 (Click to see the whole thing!)
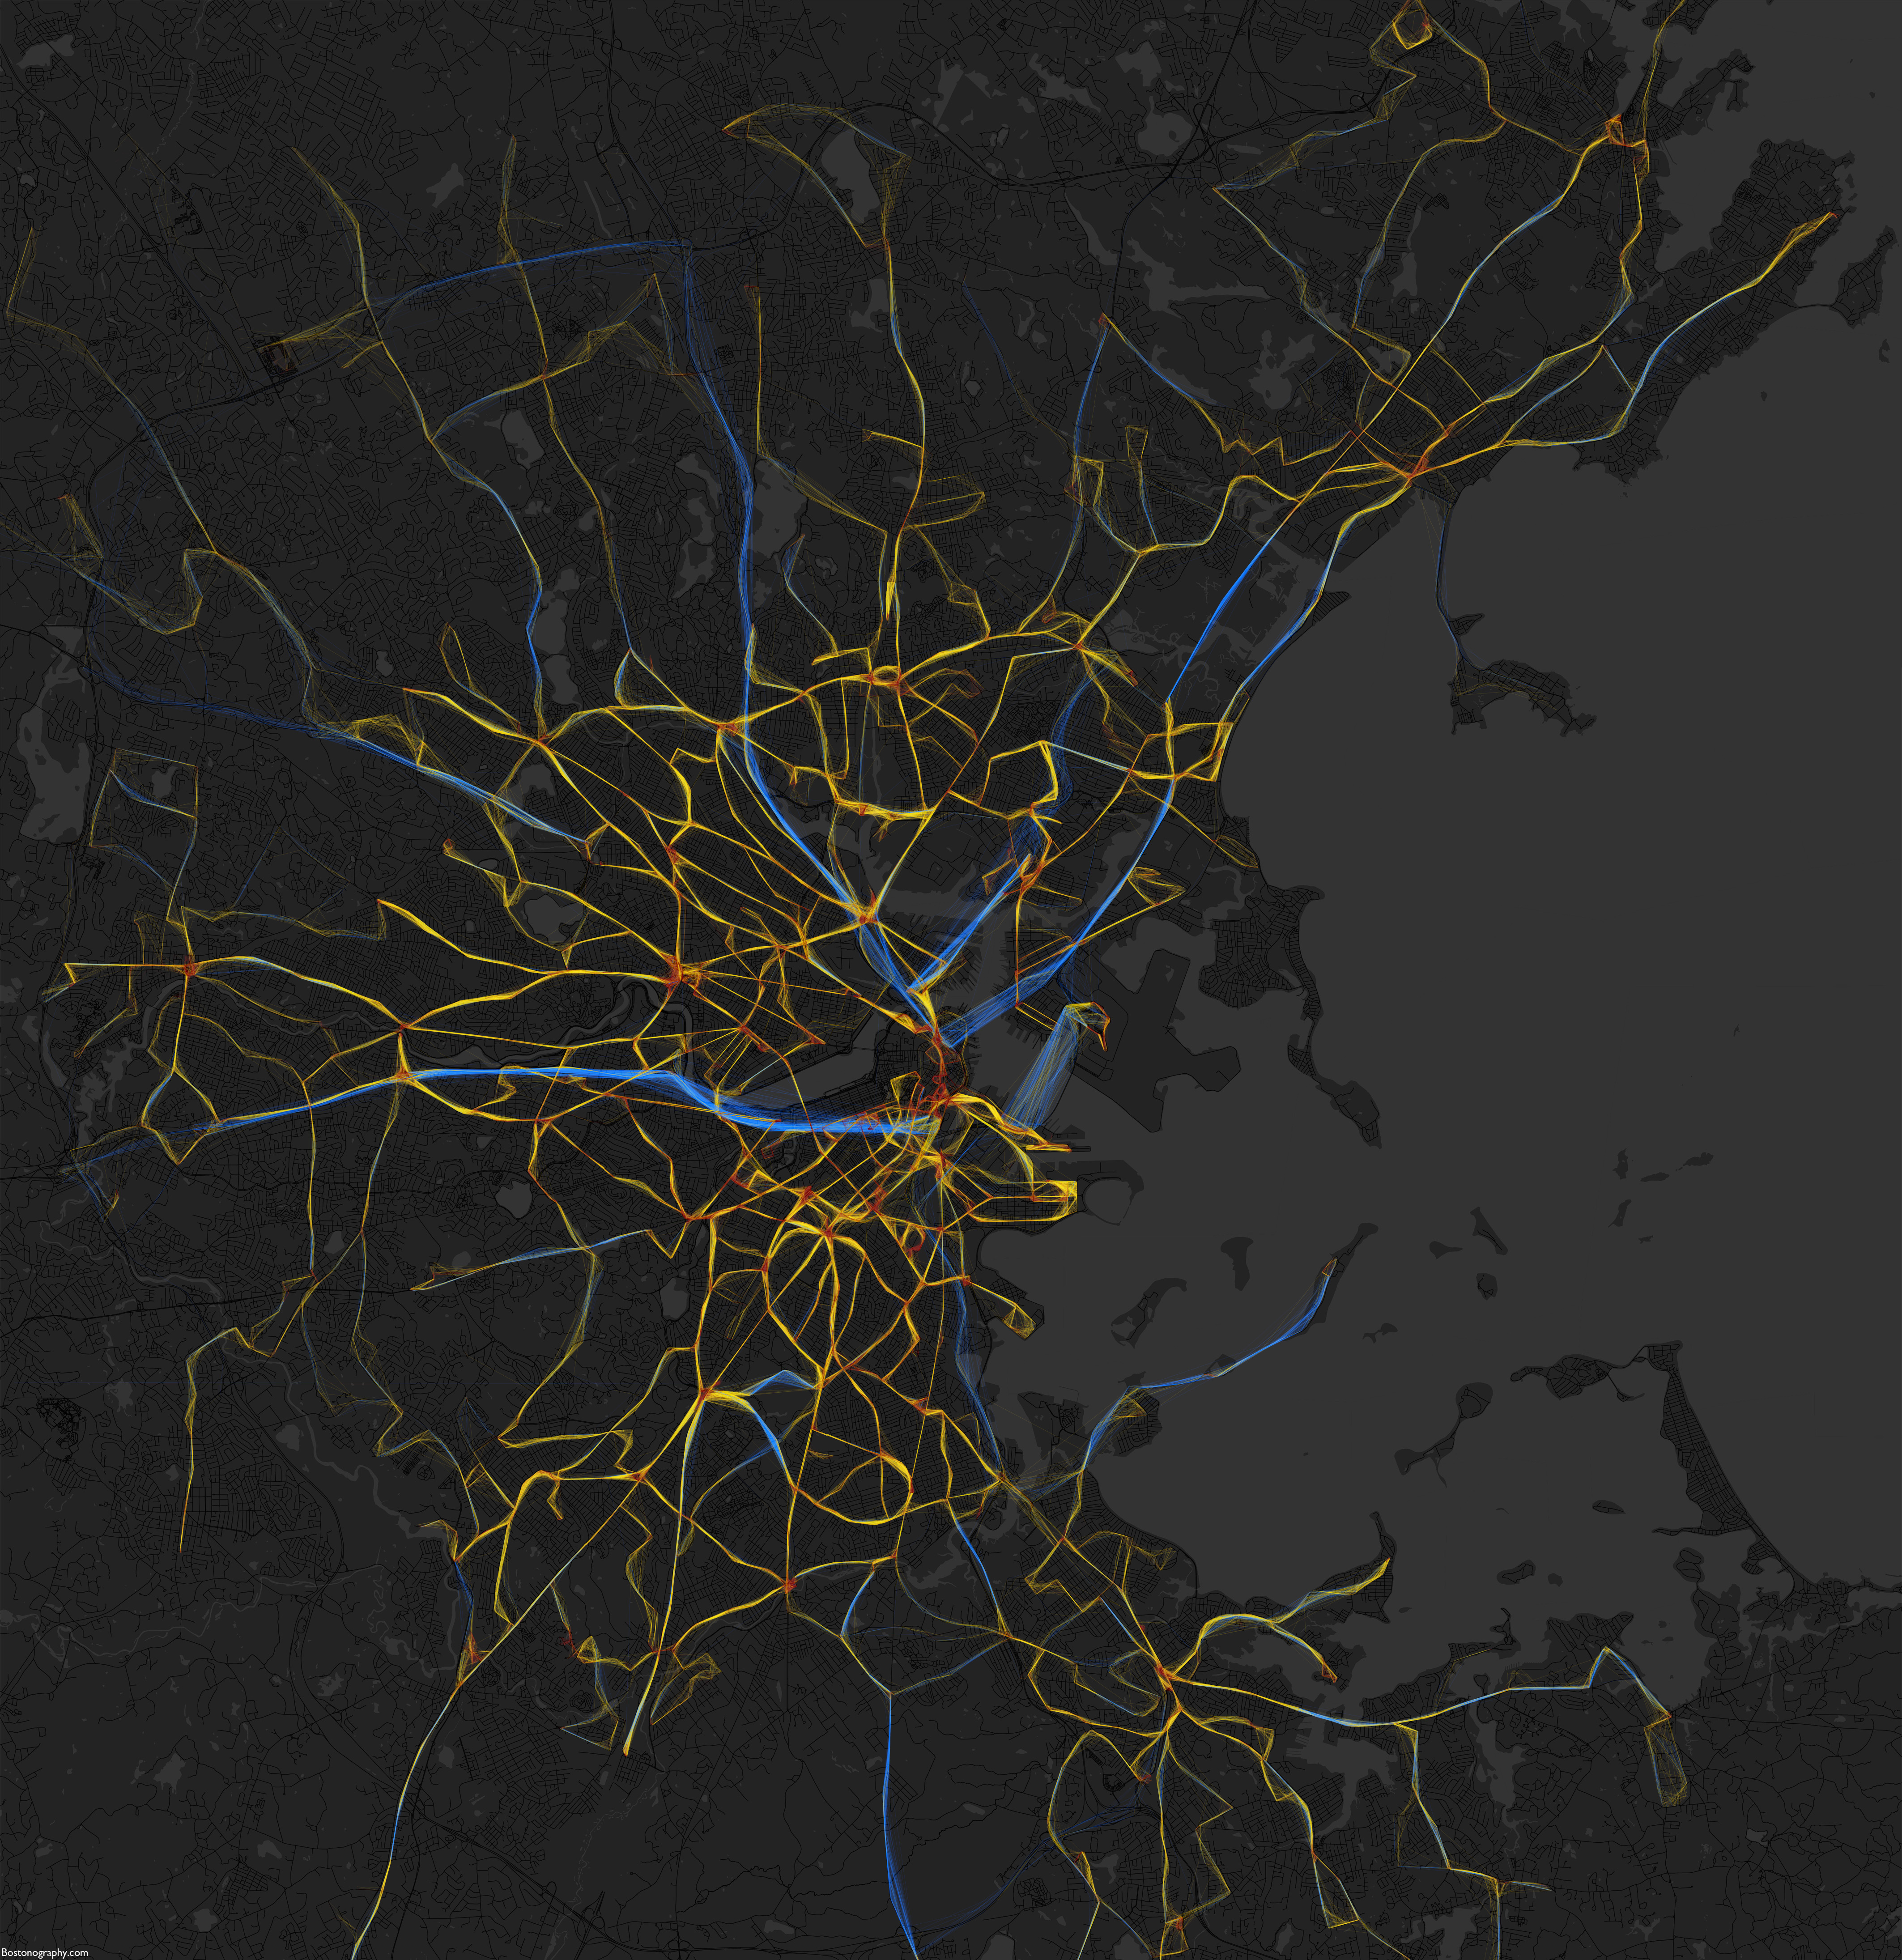
You know by now that real-time bus location data are available for the MBTA via NextBus. It’s very handy for riders, of course, but for cartographers it’s also something else: a gold mine of mappable data.
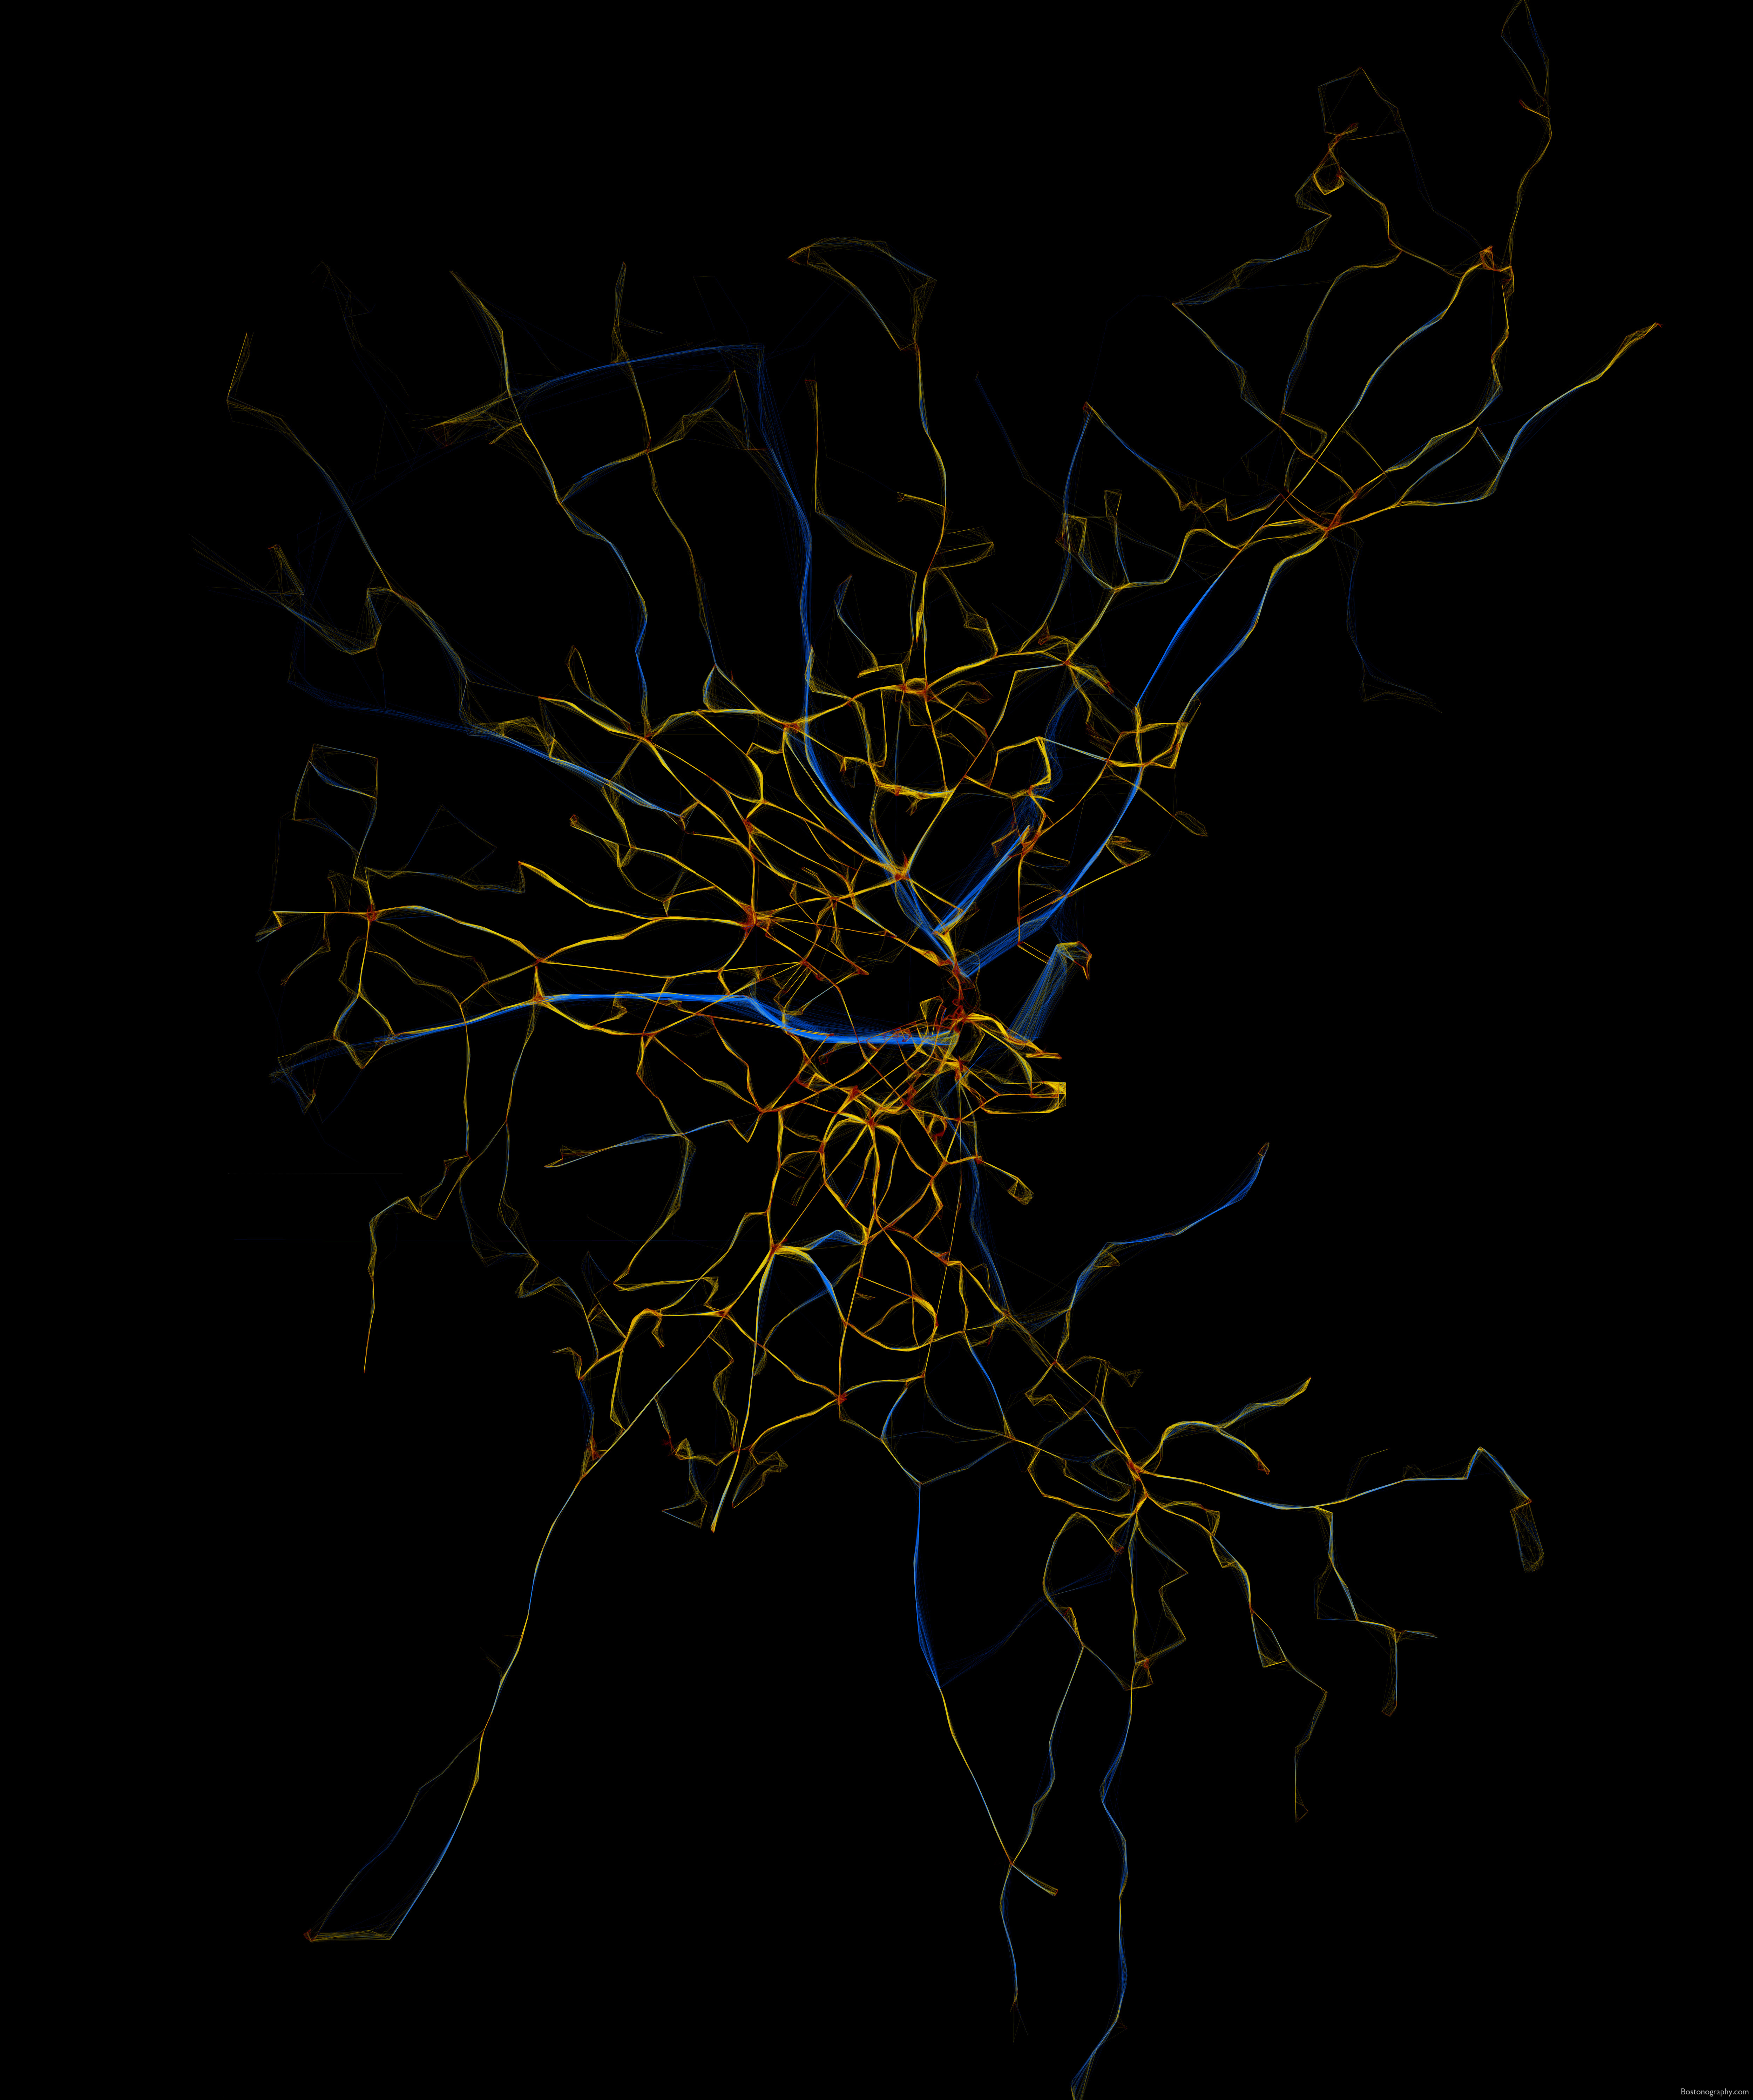
We’re working on doing something interesting with bus data, but above is a map to start. Click it or this for a big fat map of most of the MBTA bus system. (Or an unlabeled version or no-roads version for only mysterious pretty colors.) It shows a bit more than 24 hours’ worth of bus location data from last Friday, November 4, with colored lines representing the speed of each vehicle. Red indicates speeds less than 10 miles per hour, yellow is 10–25 mph, and blue is faster than 25 mph. It’s drawn from 2,058,574 data points in all. The concept is totally lifted from Eric Fischer, who really is the master of mapping all things geotagged and whose work you may have seen. (This “Locals and Tourists” map of Boston, for example.) The map here more or less emulates what Mr. Fischer did for Muni in San Francisco. We can, no doubt, expect to see future awesome bus maps of various cities from him.
For the most part buses on this day had average speeds predictably somewhere below the normal city street speed limit, with the very slow spots being around major intersections and hubs like Ruggles or Harvard Square. There are also some generally slow areas besides those, such as most of downtown. As you can see, most of the MBTA system would be toast if faced with the classic Speed scenario. The “fast” (and remember this category goes all the way down to 25 mph) lines are mostly confined to the rush hour expressway routes and some suburban roads. I expected to see more red than there is, though. I don’t often ride the bus, but the experiences burned in my mind are things like watching pedestrians cross the Mass Ave bridge more quickly than my #1.
You’ll notice that some routes show up as ill-defined webs rather than solid lines. This is presumably sometimes due to GPS inaccuracy, but other times it seems that a bus does not report its location frequently enough, which leads to long straight-line segments that skip the intricacies of a route. Loss of signal is evident in the tunnels in and around downtown, where, for instance, the Ted Williams Tunnel shows up as a bunch of straight lines leaping from the seaport to the airport.
As a bonus, this map is a keepsake because it represents data collected on the last day of this year’s Green Line shuttle bus replacement between Lechmere and North Station, which can be seen on the map. I guess that’s the closest thing we’ll get to real-time Green Line data anytime soon. Meanwhile, good thing the weekend Red Line closures have begun so we can generate more memorabilia!
Pingback: A Day In the Life of MBTA Buses at Katelyn M. Thompson's Blog
Pingback: North River Bridge and MBTA Bus Locations « Lorem ipsum dolor sit amet…
Pingback: A Day in the Life of the MBTA Bus System
Pingback: TN MOVING STORIES: Lima’s Public Transpo System is a “Killing Machine,” Two Domestic Airlines Now Using Biofuels, Capital Bikeshare Expanding This Week | Transportation Nation
Pingback: An MBTA bus-iness day | Bostonography » As Smart as You Think
Pingback: Making Transit Travel Speed Maps with Open Source GIS « Indicatrix
Pingback: Boston & Minneapolis Family Feud « Getting Around Minneapolis
Pingback: Maximizing Golden Gate Transit: Headways Schmeadways « The Greater Marin
Pingback: Art+Transportation - Bus Routes Like You've Never Seen | Transportation Issues Daily
Pingback: Live MBTA bus speeds | Bostonography
Pingback: City Links: Gridlock and Recovery Edition - The Blue Review | The Blue Review