Ah, The Super Bowl. Whether the home team is in the game or not (ahem… ours is), we can’t help but use the occasion as an excuse to hit up the local watering hole and have a few drinks with the gang. But what does “local” mean in this case? Many towns and neighborhoods throughout Massachusetts have a variety of pubs, bars and taverns in the space of a few blocks. Other parts of the state are virtually devoid an establishment where you can sit down and have a drink.
In November, The Boston Business Journal published the locations of all restaurants and bars licensed to serve liquor, wine or beer in Massachusetts. After a reader challenged us to make a map showing the distance to the nearest Dunkin’ Donuts for every location in Boston, we’ve been contemplating other datasets for which this kind of analysis might be worthwhile. Liquor license locations seemed appropriate this week, since an abnormally huge number of people in The Bay State will be taking advantage of them this weekend.
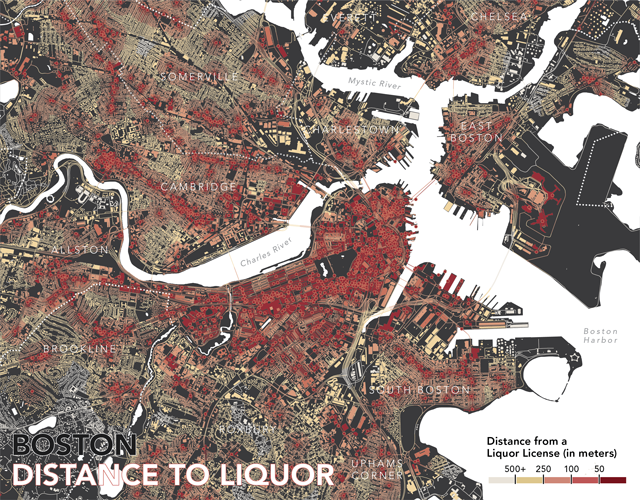
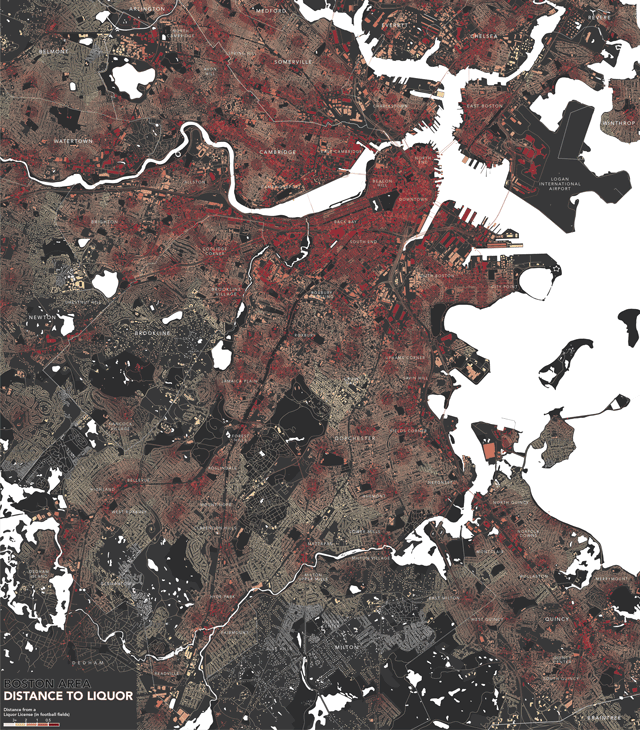
The first map pictured here shows street segments and building footprints in the Boston area coded according to their proximity to liquor licenses. The result could be used as a walking distance map, though one is never too far from a liquor license in the city. Parts of Brookline are barely a mile from a liquor license, while other “liquor deserts”, like South Boston, East Boston and Roxbury are only around half a mile.
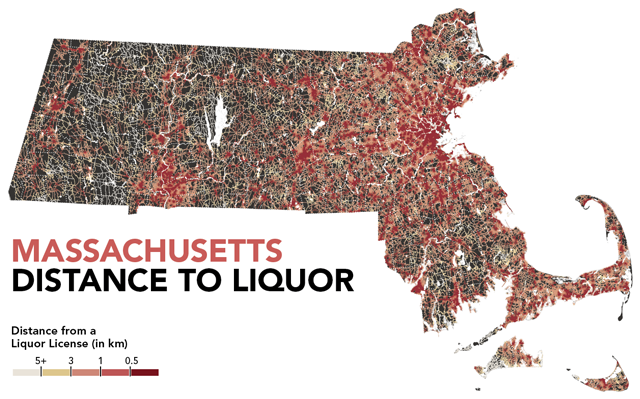
A similar map of the whole state, using just road segment distances from liquor licenses doesn’t look too far off a population density map. With a distance map, however, the number of liquor licenses in a one location does not influence the look of the neighborhood or region like it would in a density map.
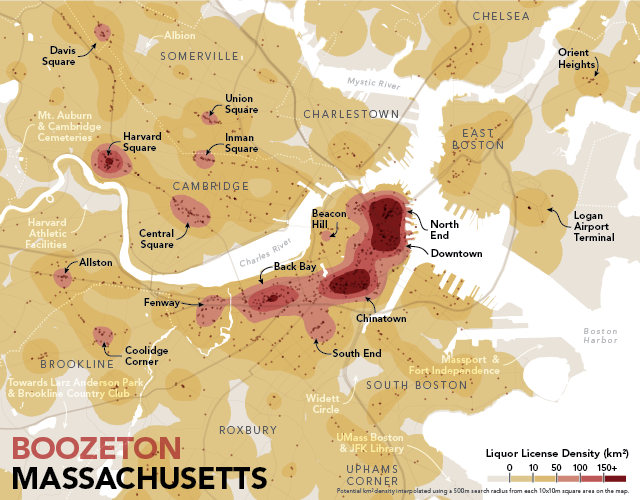
Density (or, vaguely, heat) maps can be made in a number of ways. In the case of the population maps from last month, the “density” was determined as a function of people inhabiting a certain space (people per acre, for example). The more of a certain phenomenon in one locale, the higher the density. In order to do for towns, you simply divide the area of the town by the number of people who live there. If you aren’t wild about arbitrary administrative boundaries, density can also be visualized purely based on the phenomena. In this case, the density of liquor licenses in the Boston area was calculated for each 10x10m area on the map by tallying up all licenses within 500m (1/3 of a mile, or roughly a walk from Copley Square to the Public Garden).
The Boston liquor license density map does a decent job pointing out the more popular hot spots for bars and restaurants. It comes as no surprise that the North End and Harvard Square have portions with a higher density than in other parts of the city. It may be interesting to see, however, that Davis Square has a larger concentration than Porter Square, or that the Harvard Business School and Athletic Facilities are in a very low spot.
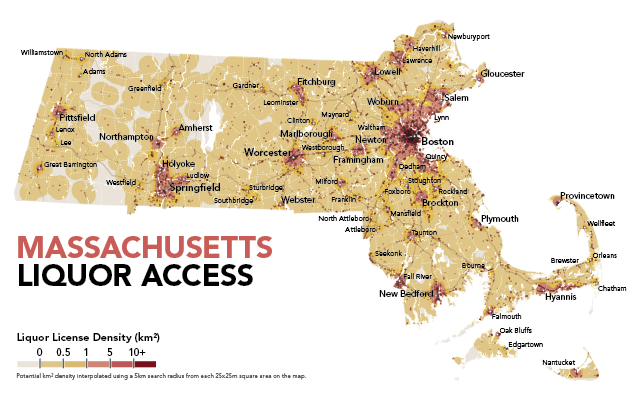
The statewide density map could be used by citizens of central Massachusetts this weekend. If you want to head to a bar or restaurant to watch The Patriots do battle with The Giants on Sunday, you might head to an area with a larger concentration of liquor licenses… and hopefully more standing room. Speaking of the Patriots, check out the little warm spot that surrounds Foxboro. Without Gillette Stadium there, would we see that blob?
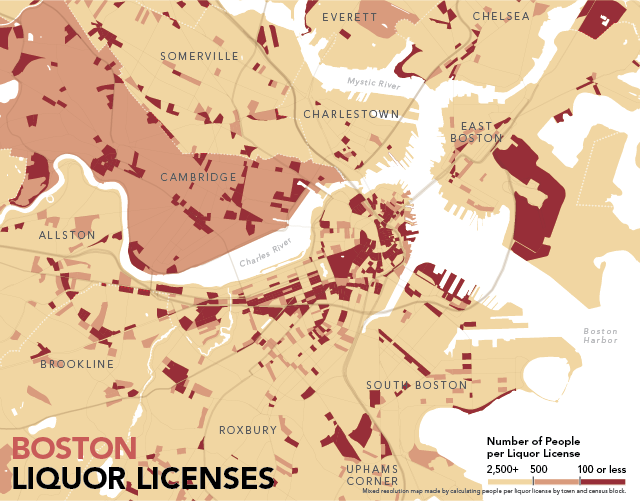
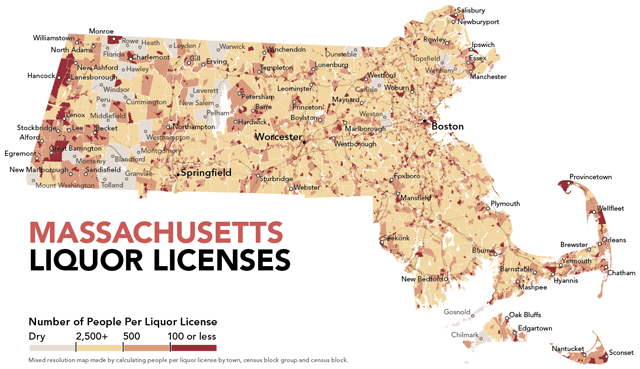
Heat maps are fun and they often garner a great deal of buzz. But more often than not, a heat map fails to tell the entire story. For this reason, I took a step back and made some trusty ol’ per capita maps (with a small twist; they are actually people per license).
While the heat maps essentially show access to establishments with liquor licenses, people per license maps show where supply is exceeding (local) demand. Admittedly, this is an odd metric for a metropolitan area. The people drinking at Logan, for example, are almost certainly not inhabitants of East Boston. Still, we may get a good idea of how much drinking is going on in neighborhoods throughout Brookline, Cambridge and Somerville.
A statewide map showing people per liquor license reveals a definite trend. Aside from the urban cores of Boston, Worcester and Springfield, other hot spots emerge. Coastal areas like Provincetown, Nantucket and Edgartown have fewer people per license due to the seasonal influx of tourists. Less populous towns in the western portion of the state also show up with low numbers of people per license. Two reasons for this come to mind. First, with smaller numbers of inhabitants, losing or gaining a handful of licenses could easily skew the proportion. Secondly, the majority of Massachusetts “dry” towns are located in the western half of the state. Some neighboring towns could have a higher demand for liquor licenses due to local and regional clientele. To illustrate this possibility, have a look at Monroe. It is surrounded by dry towns and has the third-lowest rate of people per liquor licenses in the town (~90).
Of course all of this is predicated on licensed drinking. In a internet-search-fit of disbelief over the fact that there are no establishments licensed to serve liquor in Weston, I came across this article from last autumn. So, it would seem, if you’d like to watch the game this weekend over some drinks, I have three options: your home, a licensed establishment, or a modern-day speekeasy.
Wherever you drink, be safe and don’t try to read these maps whilst driving.
Go Sawx. Er, I mean, go Pats!
* Five notes: 1. Dataset includes establishments licensed to serve on the premises. Liquor, convenience and grocery stores are not included. 2. Some errors may exists in the liquor license location data. Some new licensees may be missing and recently defunct ones included. Also, when mapping 8,000+ disparately formated addresses, 100% accuracy is nearly impossible. Apologies if we’ve misplaced or left your favorite liquor licensee off the map. We did not intend to offend. 3. Apologies if the unit of measure in the density maps (square kilometer, or ~250 acres for you farmers) seems a tad misleading. Of course the map isn’t chopped up into nice square kilometers. That would be entirely too Canadian for a Boston-based blog. Instead, it is an arbitrary unit of measure by which density was measured. It just as well could have been square feet or square miles. 4. The last two maps are mixed-resolution. For a simple statewide choropleth by town check out this guy. 5. Because of various complaints for leaving out many parts of the greater Boston area (and for using the metric system), here is one last map. The unit of measure: football fields.
Whoa this is a fabulous writeup!!! Beautiful maps too. Boozeton, hehe.
Thanks, Gabriel! Can’t beat a booze-based geography pun… unless it’s terrible, like Moonshinechusetts.
Nice work, fellas – I think this will get some much deserved linkage.
Thanks, Dr. Berries. Link it up.
Well done – just beautiful maps in addition to valuable data.
Thanks so much. It was a fun post to pull together. Restaurant licenses next…?
Now, if you were to get into programming apps for something like this…
I’ll put Andy on this ASAP.
It’s not too puzzling why Harvard Athletic Facilities are relatively dry. It’s mostly open space devoted to fields. And Lower Allston is a dead semi-suburb: just look at how much fighting there was over one beer & wine license at Barry’s Corner.
Porter Square itself is a giant parking lot, all the bars and restaurants are scattered down Mass Ave, hence its low density.
What really puzzles me is Coolidge Corner. There are quite a number of restaurants here. I guess they have liquor licenses. But if you asked any resident whether Coolidge Corner was a good place to get a drink, the answer would be: “No, go to Allston or Washington Square instead.” Off the top of my head, I can only think of two bars that are actually in Coolidge Corner: the Clubhouse and the Corrib Pub. Three if you count the Regal Beagle.
Thanks for the comment! While some of these trends may be unsurprising, we hope they are at least mildly compelling. Having lived in Coolidge Corner for years, that hotspot doesn’t surprise me at all. Places like Zenna Noodle Bar, Finale, Chef Chow, &c. bump it up. Have a look.
Well yes, the restaurants have licenses, but there’s a world of difference between say … Jerusalem Pita and their use of a liquor license, and let’s say … the Sunset Grill – to pick a couple of examples. Counting them the same on the map is confusing. Of course, it is probably a lot harder to assemble data to fix this. 🙂
P.S. Finale is gone. Last year was their “finale.”
P.P.S. Did you use Google Fusion for all these maps? It seems nice but very rough around the edges.
Matthew—If you are talking about somehow getting our hands on a dataset that includes the number of alcoholic drinks consumed at each liquor licensee, then, yes, that would be a lot harder to assemble. I suspect there are some stats out there detailing the distribution of booze by company, but I’d be shocked if we could get it in a resolution that would be worth mapping at a local scale. Thanks for the heads up about Finale. As I mentioned (disclaimed) at the bottom of the post, some new licensees may be missing and recently defunct ones included. Such is the nature of datasets that are really just a snapshot in time. Finale is a perfect example of this. We did not use Google Fusion tables for any of the maps, though it was the source of the data. The Boston Business Journal published the article linking to the table from which we used the addresses for geocoding. But, again, as I mentioned in the post, 100% accuracy in geocoding is an unreasonable expectation when both the sources and formatting of the addresses vary. I hope this clears it all up for you. If we get a better dataset, believe me, we’ll map it!
I wish your “local” maps would extend just slightly more to the west, to cover Brighton.
It’s true. The maps could have been shifted west—who cares about the Winthrop portion of Logan, right? Nevertheless, they were framed this way because this view captured most of the notable hotspots. Sorry to have left out Brighton. It’s not polished, but here’s a quick image in case you are curious.
Al—your comment and others inspired me to make a map showing a larger portion of the Boston metro area. I have updated the post. Thanks for the nudge!
Pingback: Links 2/11/12 | Mike the Mad Biologist
Pingback: Get drunk & die | Allston Brighton Newsflash
Pingback: Bread and Beta » Common Ground with Boston Brunchers » Bread and Beta
I don’t feel that licenses for any type of business should be limited. The economy is terrible and local license boards are stuck on “no”. People should be allowed to make money.
Pingback: furabolo.org » A Cartografia está morta?
Pingback: » Is Cartography Dead? rememberthispoint