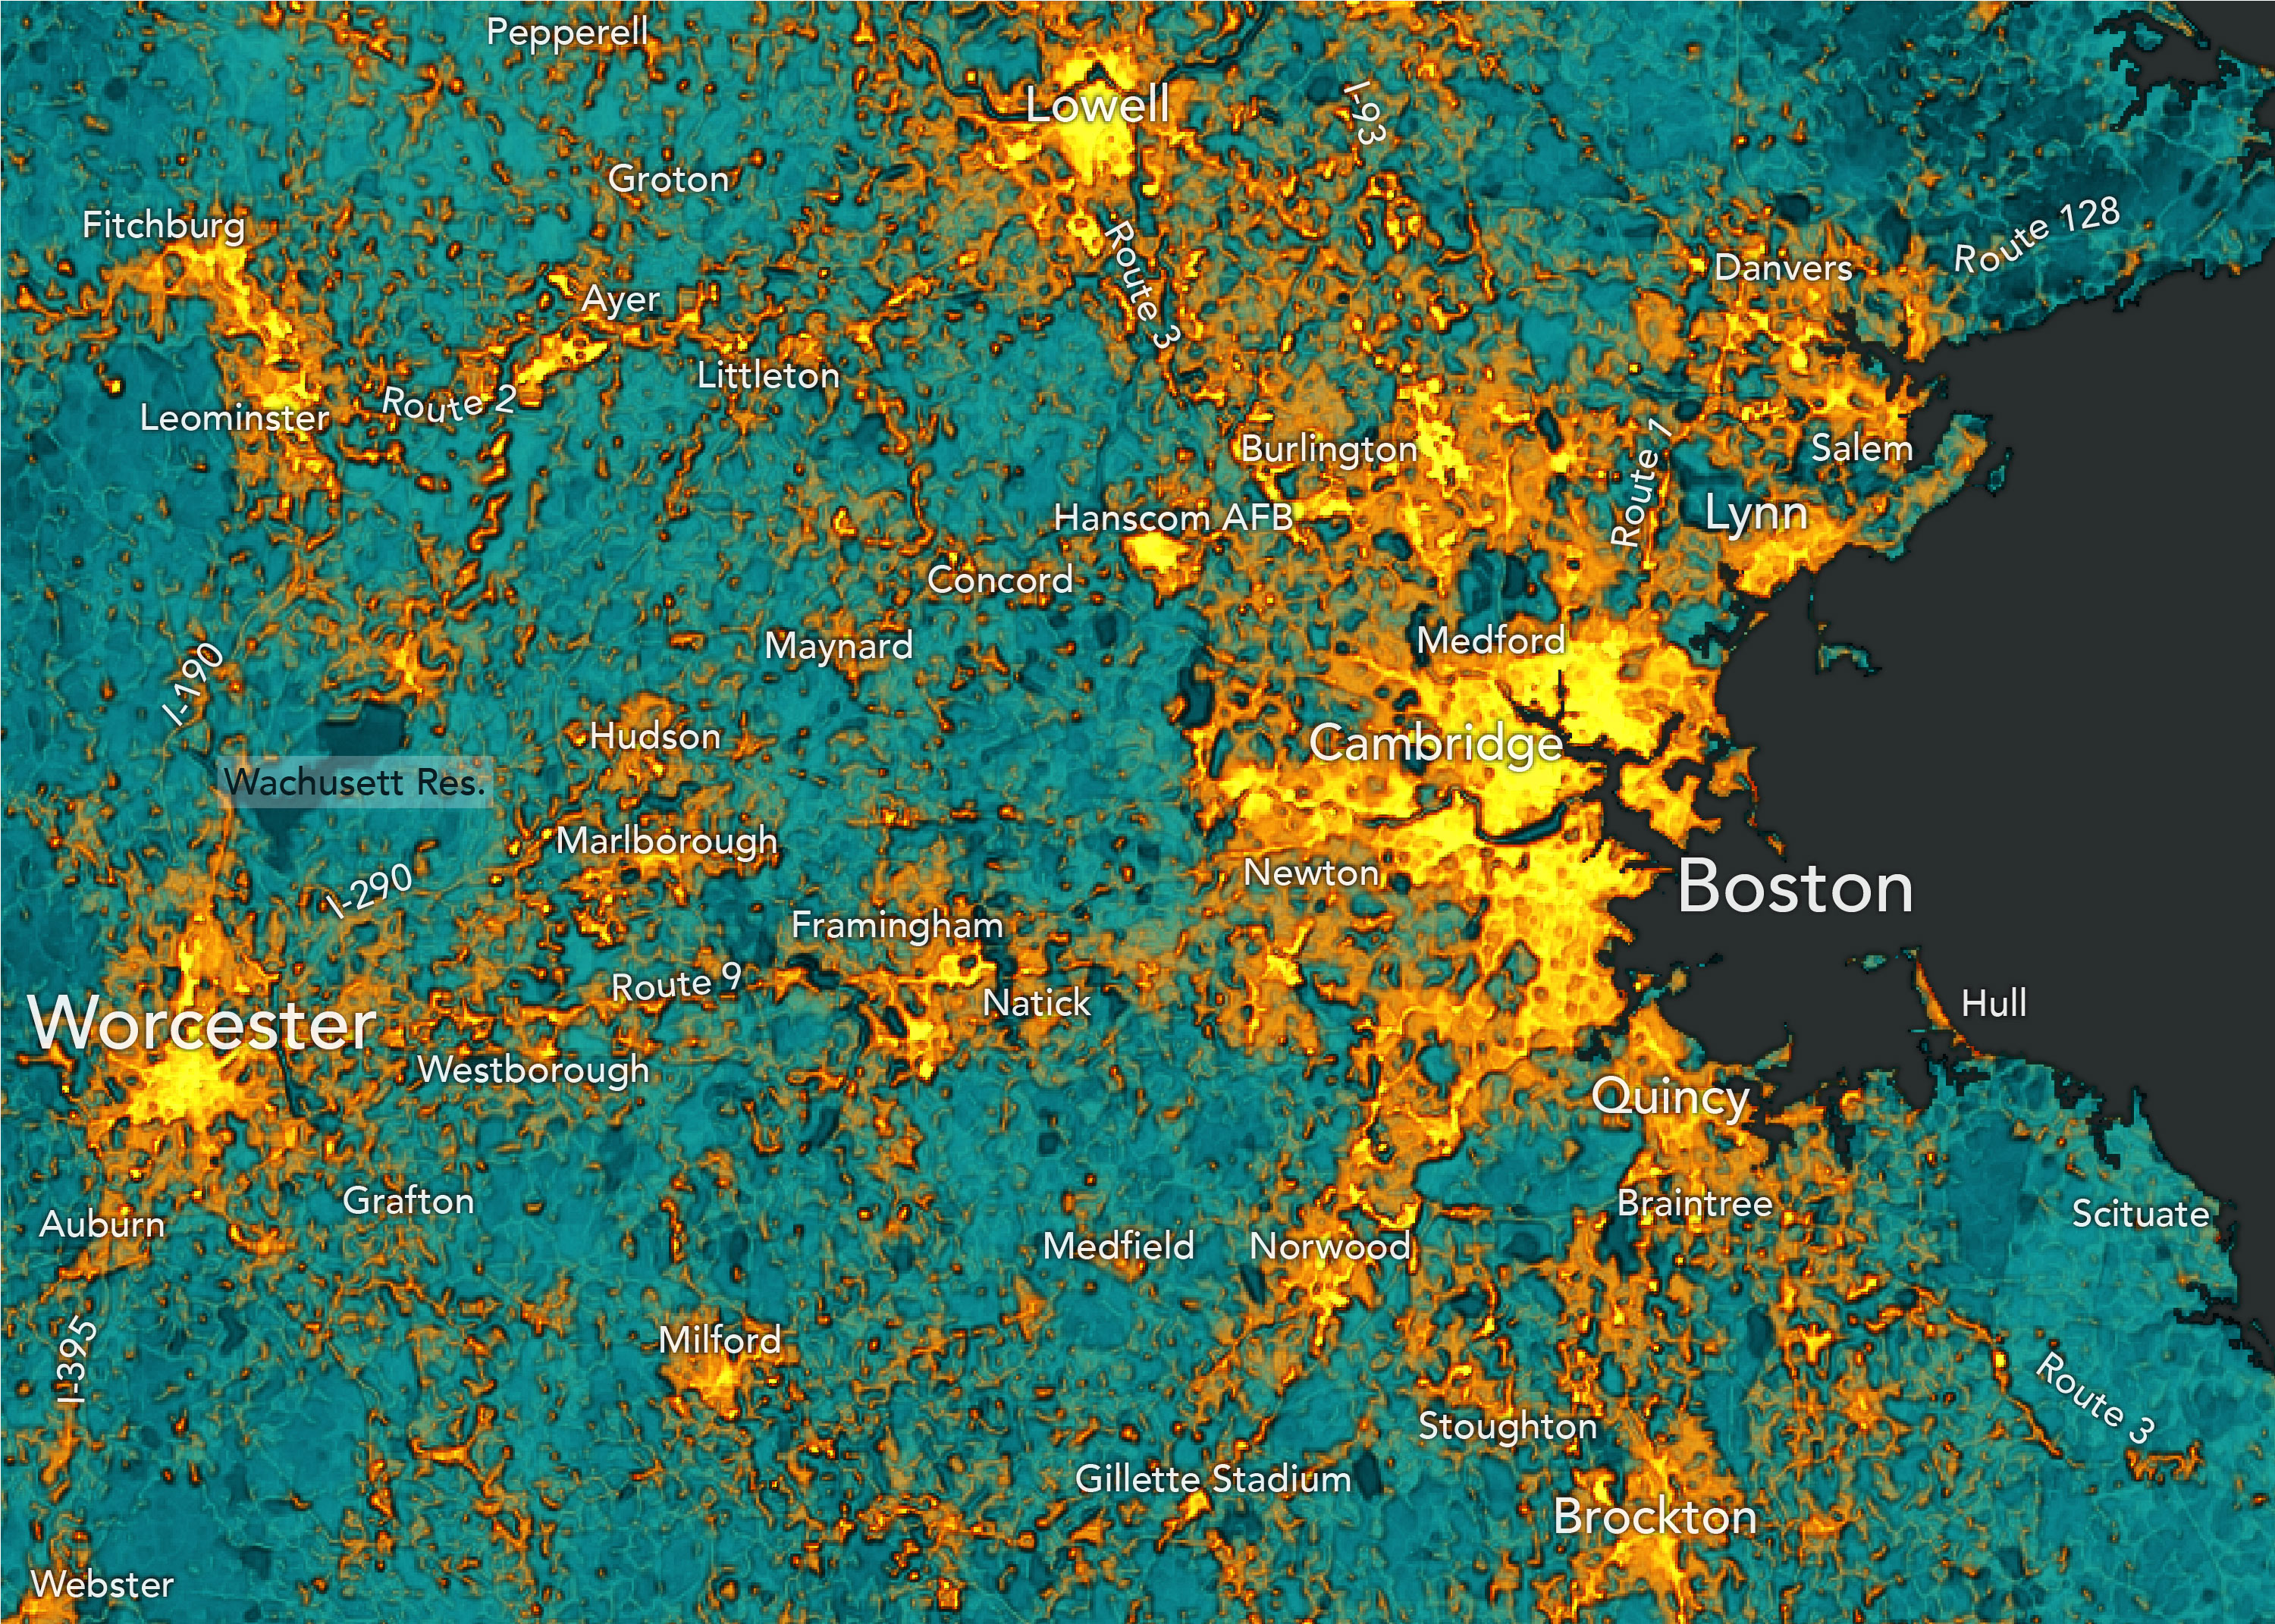
 A map of urban heat islands in Eastern Massachusetts. Brighter colors represent relatively hotter summer conditions. This map was created from a Landsat 8 land surface temperature composite of the last couple of summers, and was made by Krishna Karra at Descartes labs. Yes, Krishna has lived in the Boston area before.
About a year ago I left the New York Times and headed west to Santa Fe, New Mexico. It’s admittedly the wrong direction for an eventual move back to Boston, but what brought me here is pretty great. I now work at Descartes Labs with a talented group of scientists and engineers who constantly puzzle over new ways to monitor our earth and predict what’s next for us all on both local and global scales.
Recently, while helping some journalists look into urban tree canopies and heat islands, my colleague, Krishna Karra, created a handful of really compelling land surface temperature composites using Landsat 8 and MODIS data.
Naturally, I immediately zoomed into Massachusetts—and was rewarded! The urban heat island effect is logically most pronounced in and around cities and towns that are surrounded by thick, heat-absorbing vegetation. That’s right: those beautiful maples, elms, oaks, hickories and pines that blanket Massachusetts are sucking up heat. And the cities with sparse vegetation are all the hotter for it.
Just look at these hawt (and nawt) spawts!
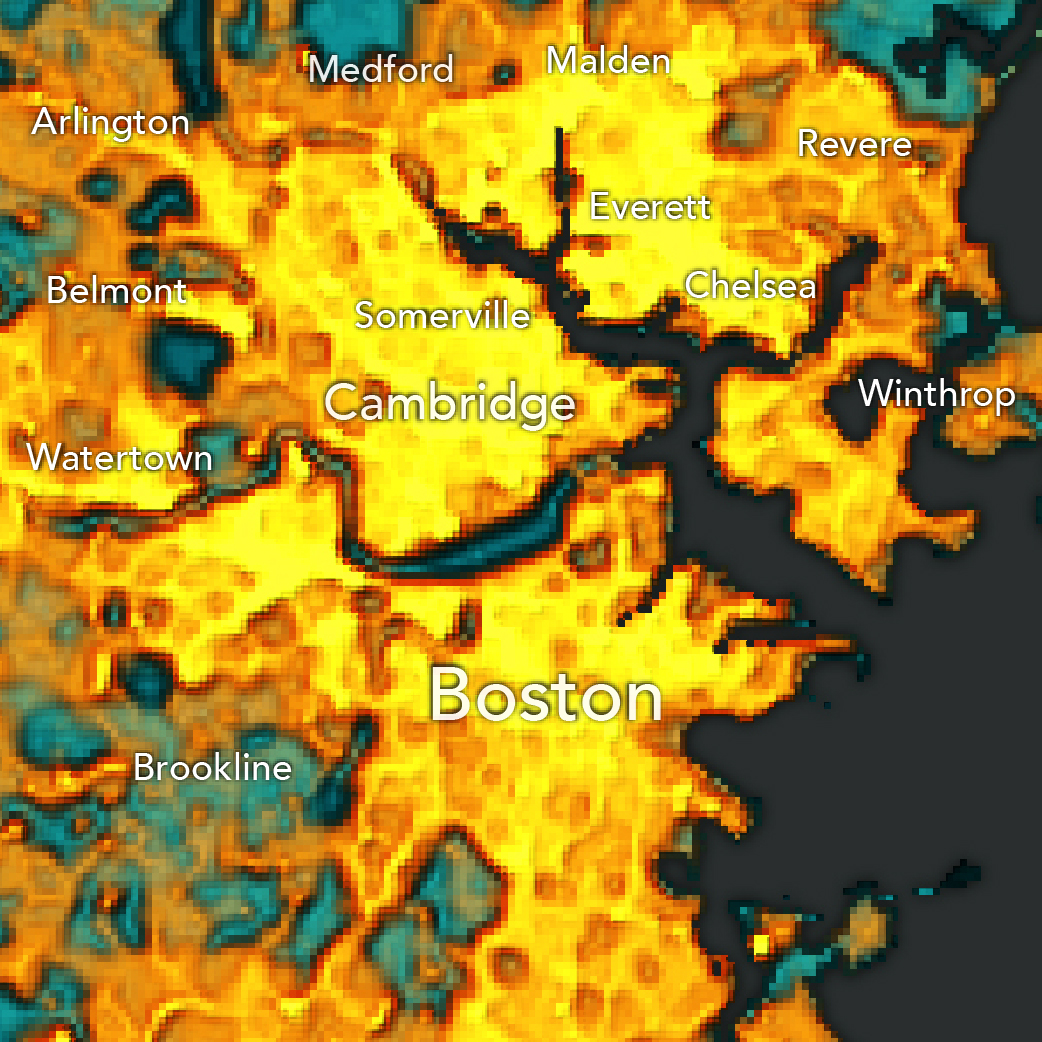
Boston metro heat islands
Boston. Combined with Cambridge, Boston makes up the largest heat island in the state. Three fun things to note here: 1. You can literally see the Boston-Brookline border in this heat island composite. Is it because of the parking ordnance? 😏 2. Hey, look—the Boston Common and Boston Garden are cool! 3. The Charles River is a veritable trench of chilliness compared to its surroundings.
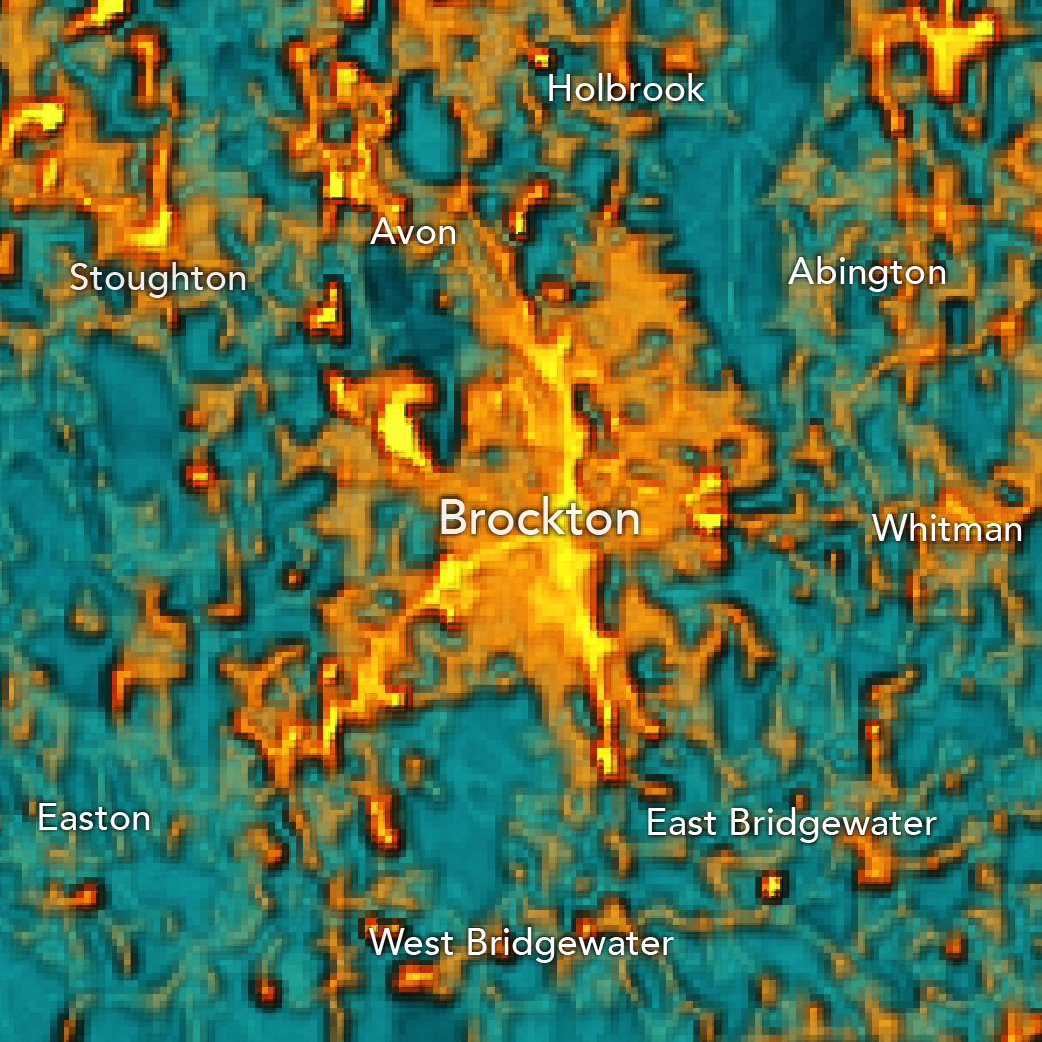
Brockton-area heat islands
Brockton. Belmont Street and Main Street create ridges of heat, intersecting in the hottest part of town. Lakes and ponds sit back in contrast.
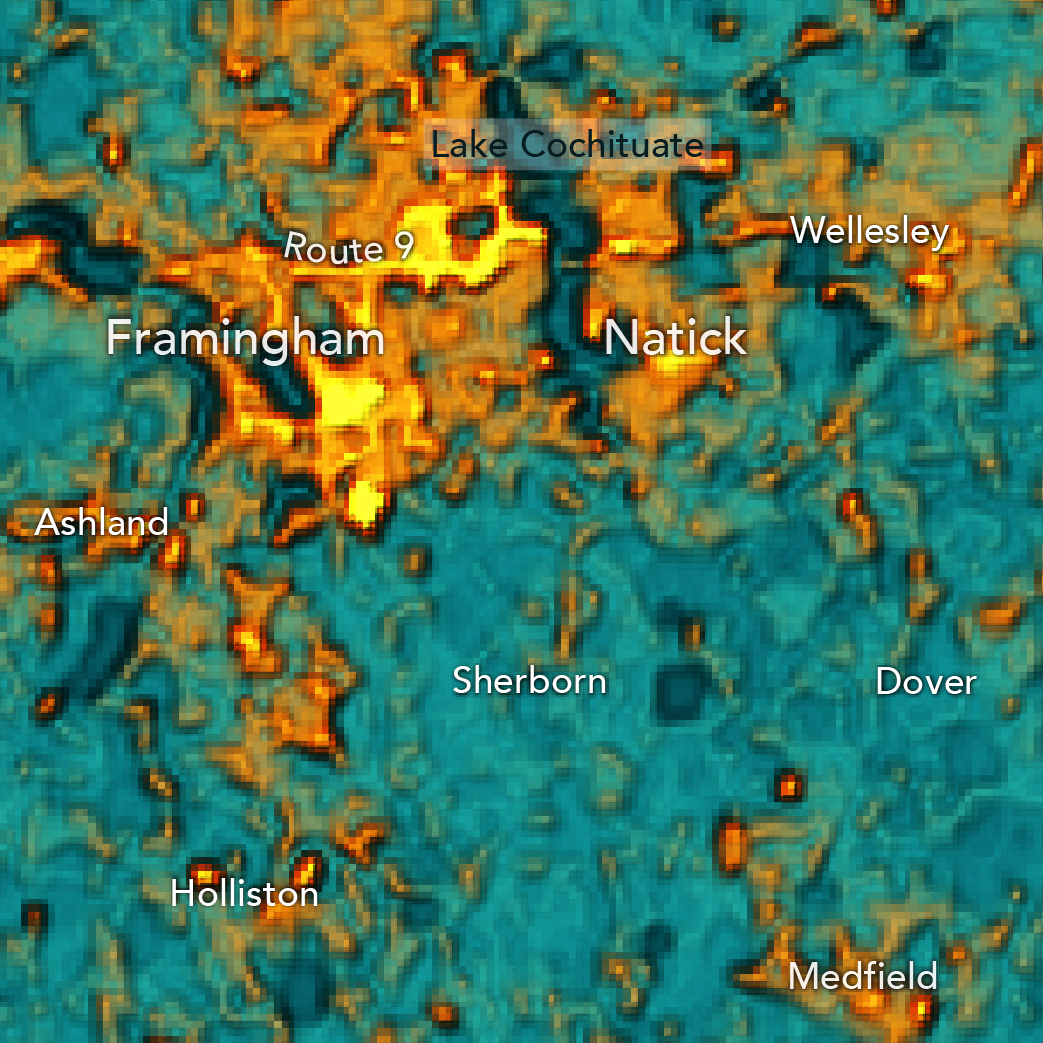
Natick and Framingham area heat islands
Natick and Framingham. I’ll confess—the weird crop here is because I grew up in Medfield. Hiiiii, Medfield! Anyway, there’s an awful lot of shopping and industry in this area that makes for some interesting heat patterns. Route 9 especially stands out as a hot line cutting across the image. For those of you who ride the MBTA Framingham/Worcester Line, you’ll feel validated to see that Lake Cochituate is every bit as cold and refreshing as it looks on those muggy August evenings when you roll by and see kids jumping into it.
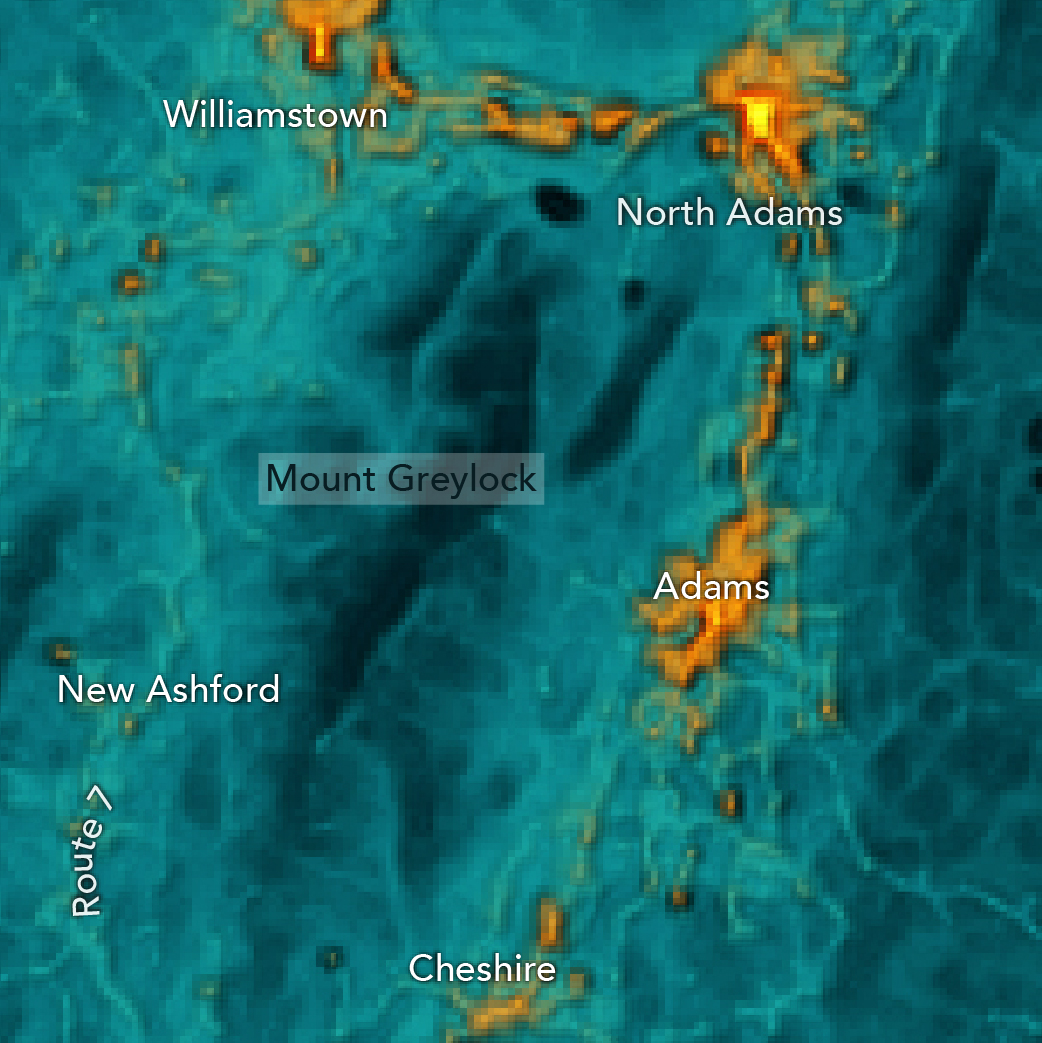
Mount Greylock’s cold shadow
Mout Greylock. Here’s a fun one. North Adams, Adams and Williamstown are relatively hot for the region, but Mount Greylock stands in frigid relief. Look at that north face! Brrrr.
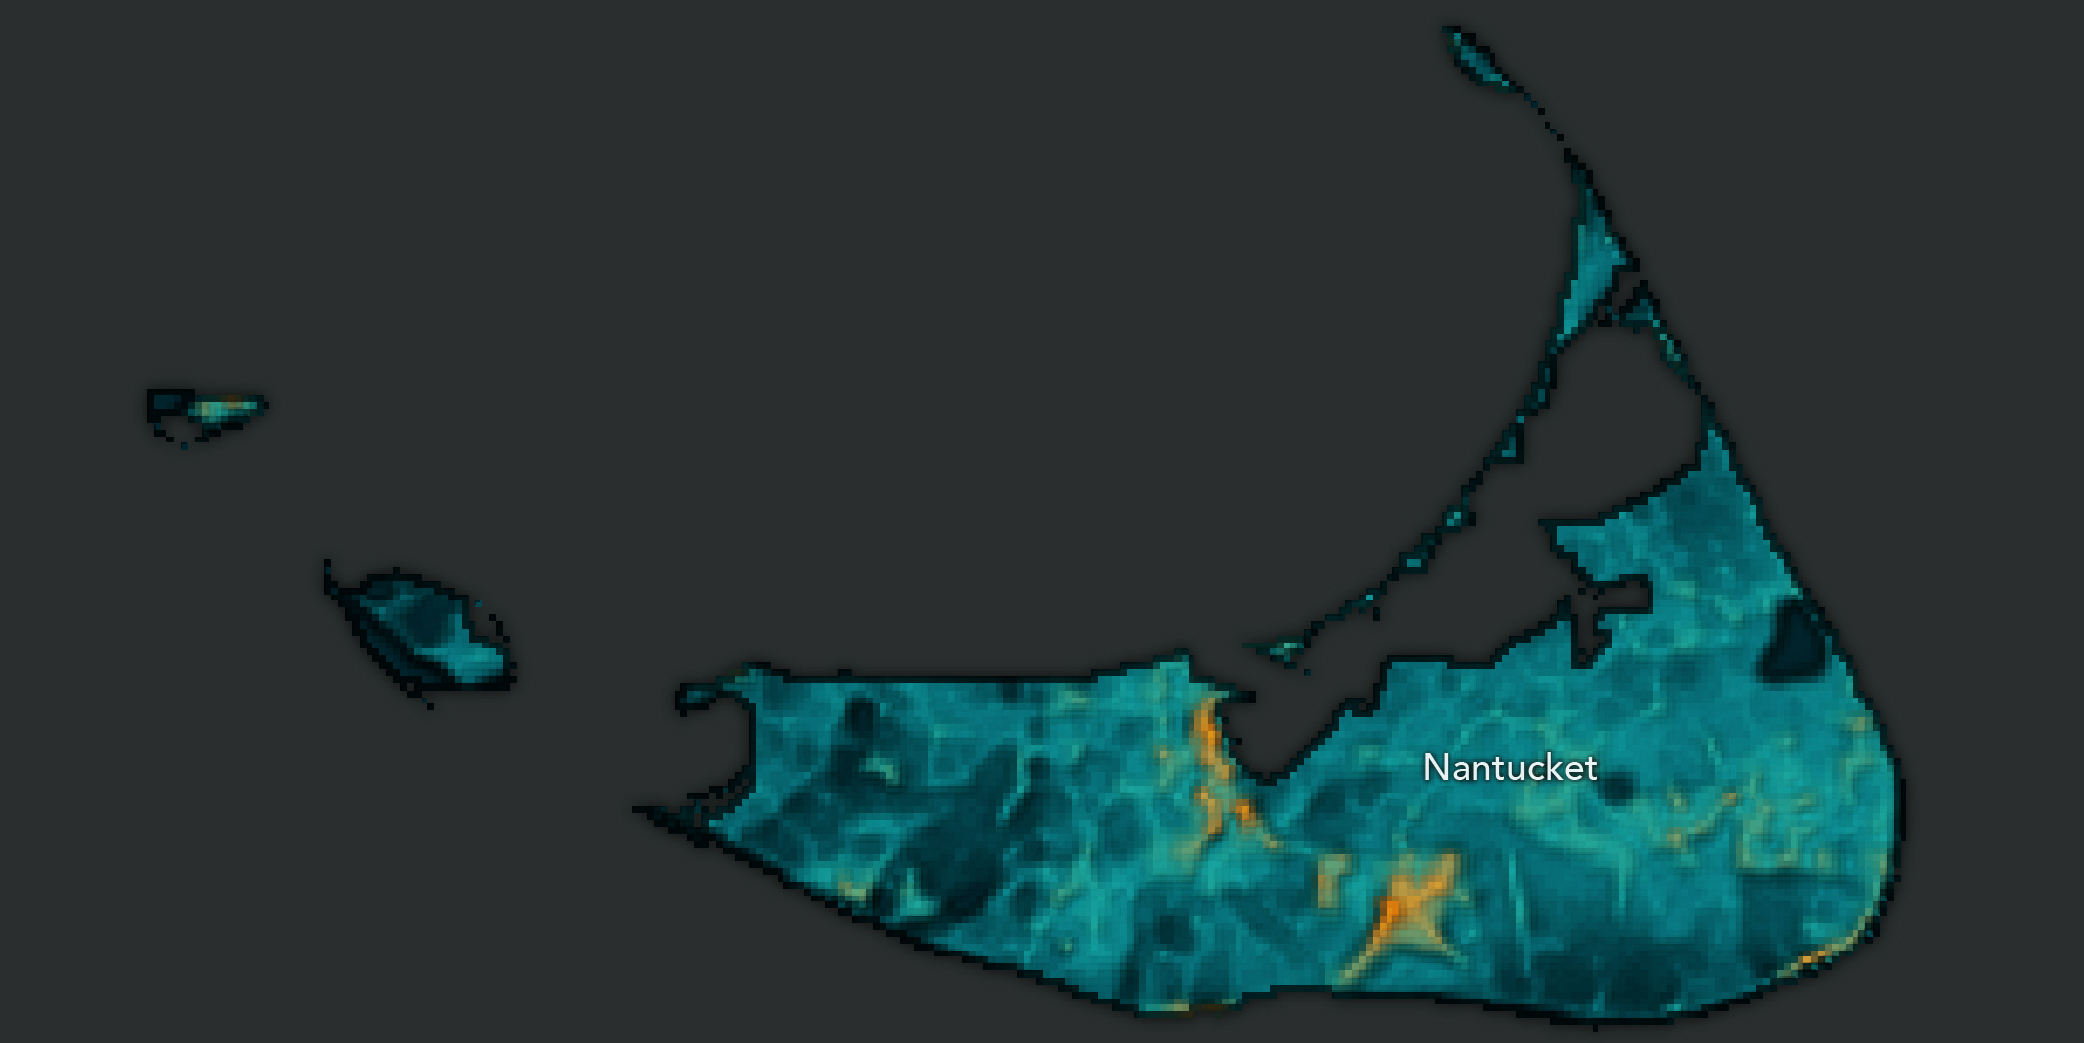
Nantucket heat islands within an island
Nantucket. Two things stand out in this image of Nantucket: town and the airport. Also, Russells Way sits as a warm ridge at the western edge of South Pasture and the sand of Tom Never Beach pops a little bit in the southeast.
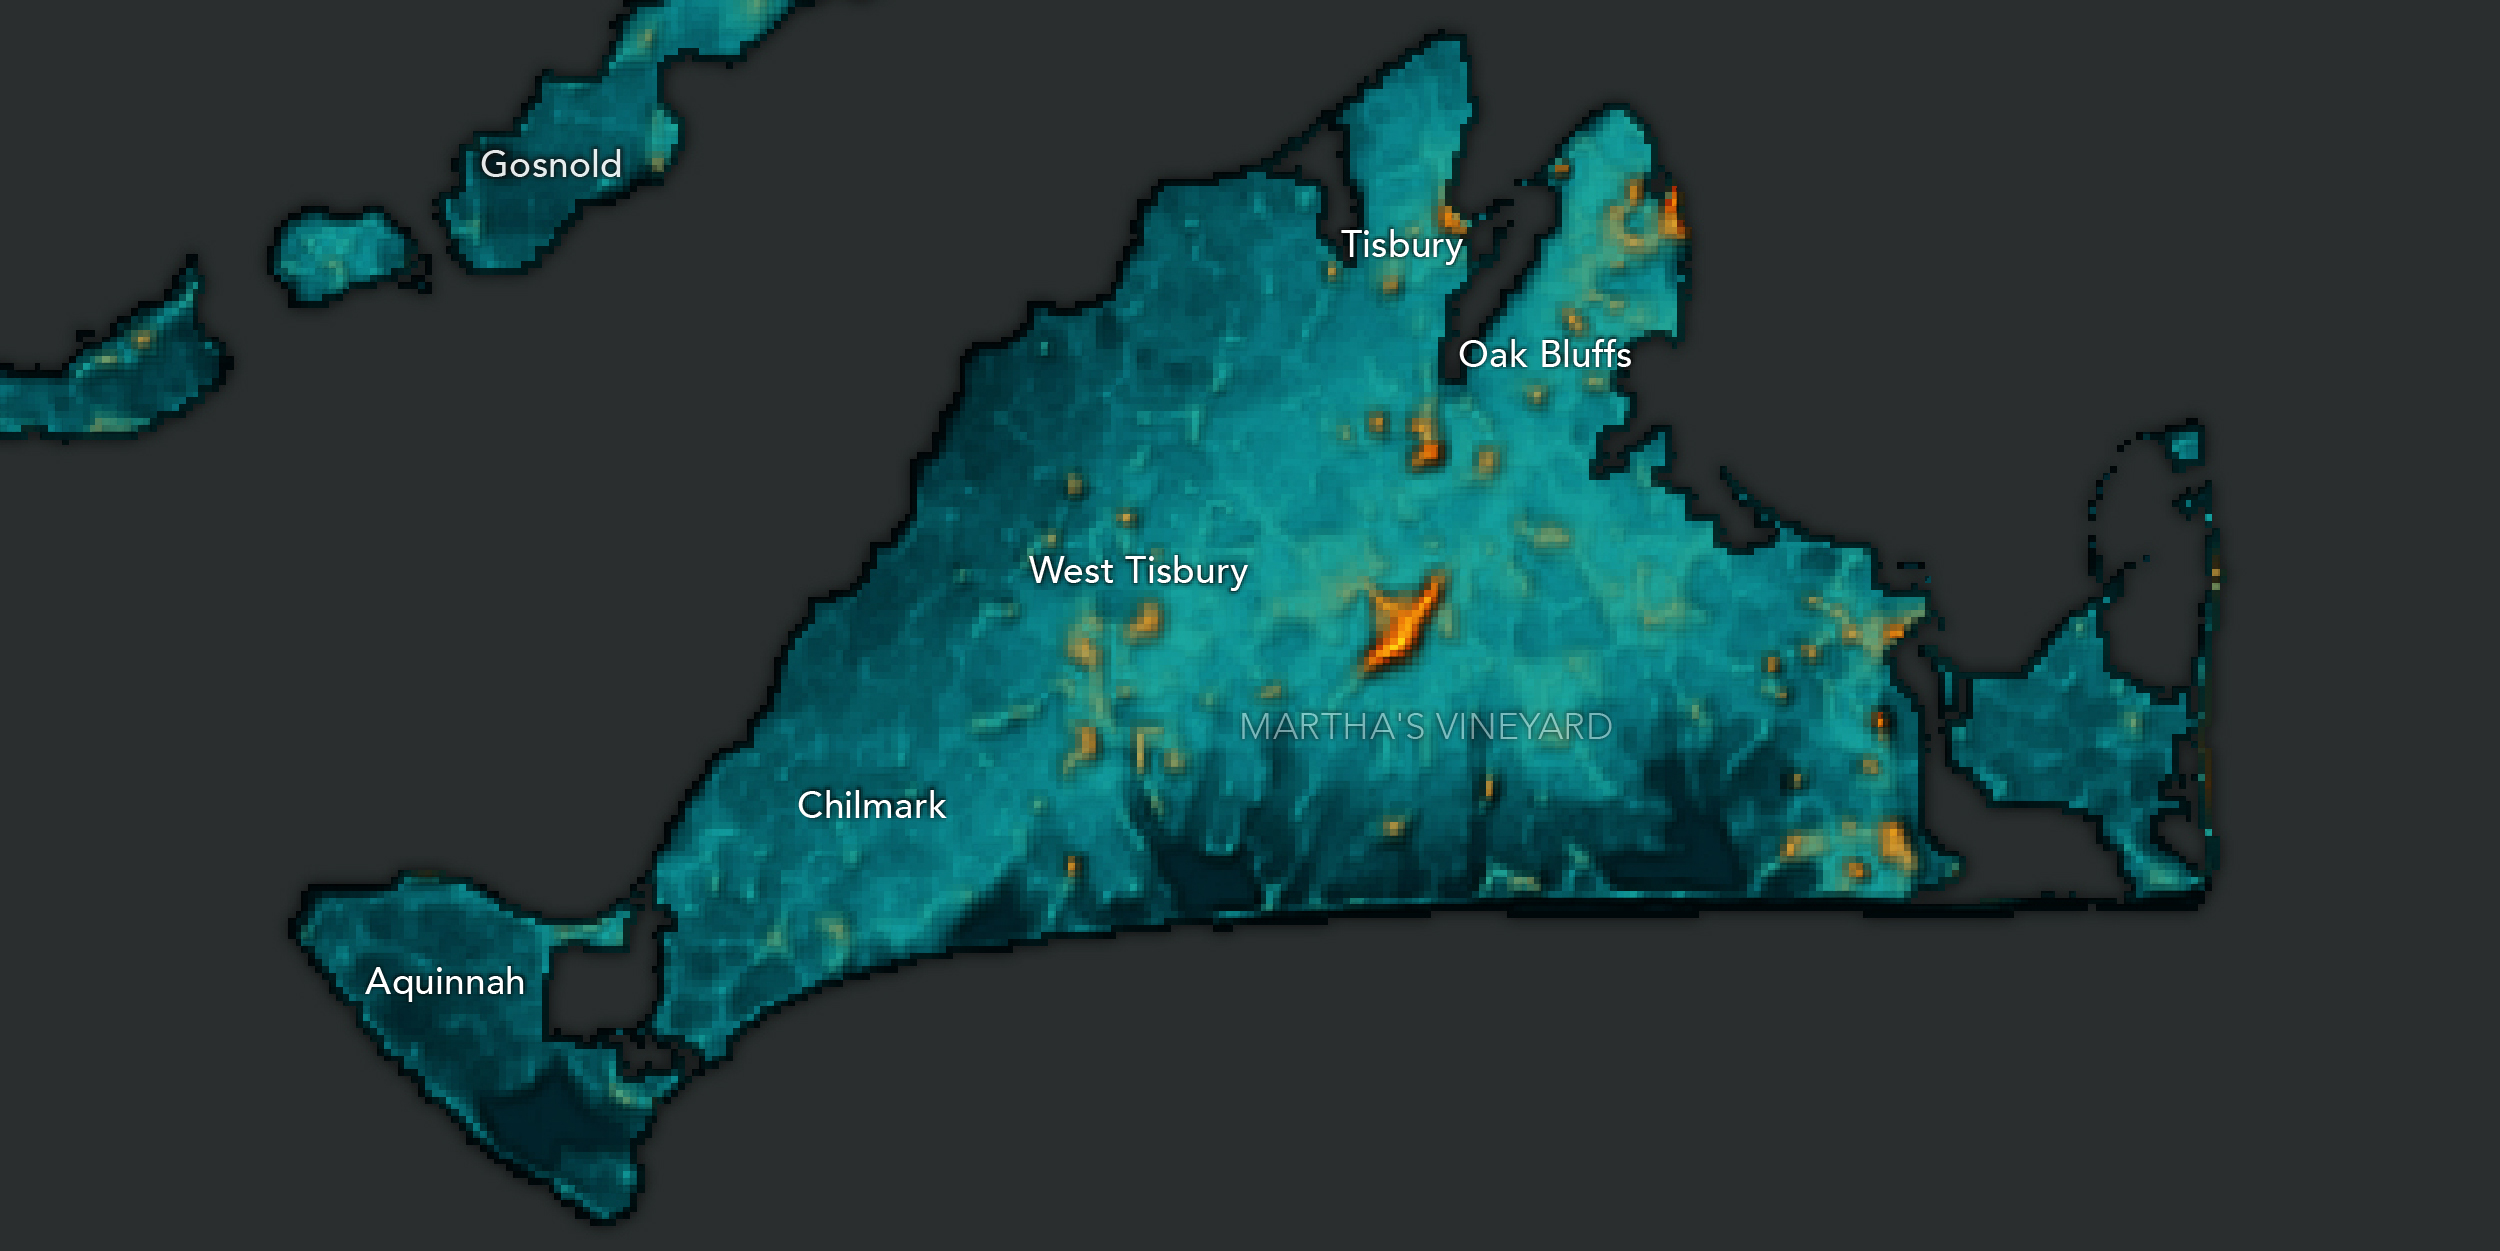
Martha’s Vineyard heat islands within an island
Martha’s Vineyard. Like Nantucket, the hottest spot on Martha’s Vineyard is the airport (really the exposed pavement of the runways). Towns are a bit hotter than their surroundings too, but the real contrast here is in the brackish coastal ponds, like Edgartown Great Pond in the south.
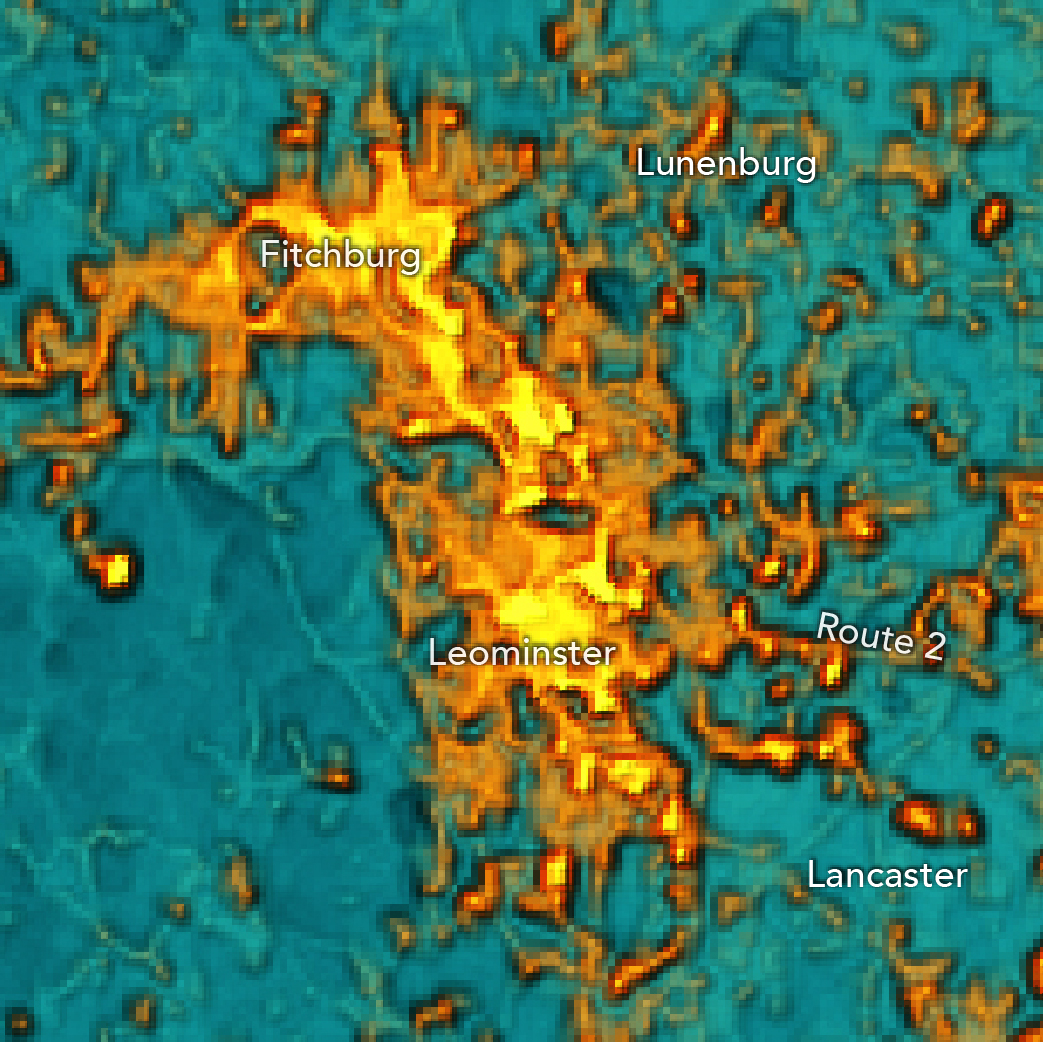
Leominster-Fitchburg area heat islands
Leominster/Fitchburg. I hear if you’re from Ashburnham, you tell people you’re from the Leminstah/Fitchburg arear. That makes sense based on this map, because those towns are HOT. It’s interesting to see development along Route 2 spreading the heat to the southeast and northwest. Coggshall Park in Fitchburg and Johnny Appleseed State Park in Leominster offer cold relief abutting these otherwise toasty towns.
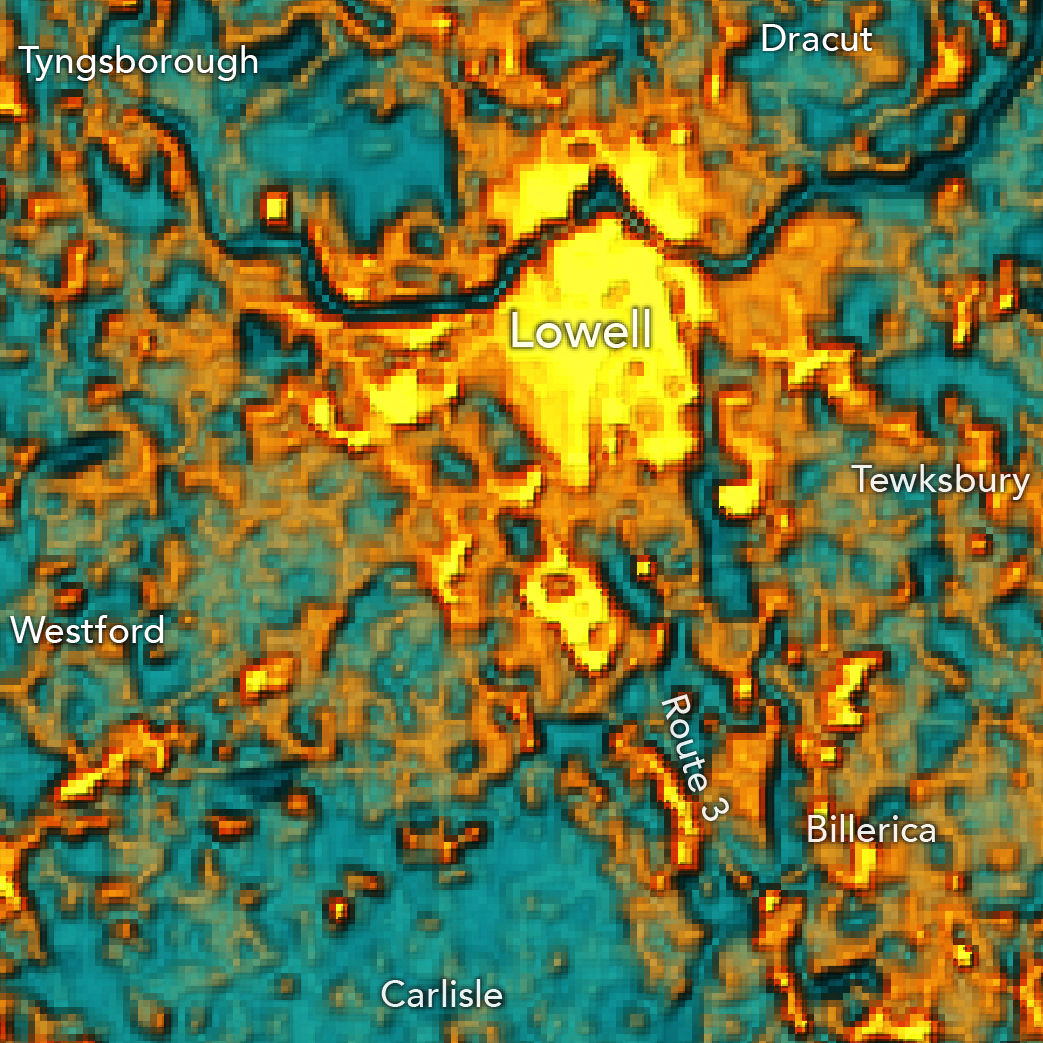
Lowell heat islands
Lowell. Lowell is hot. The Merrimack River is not.
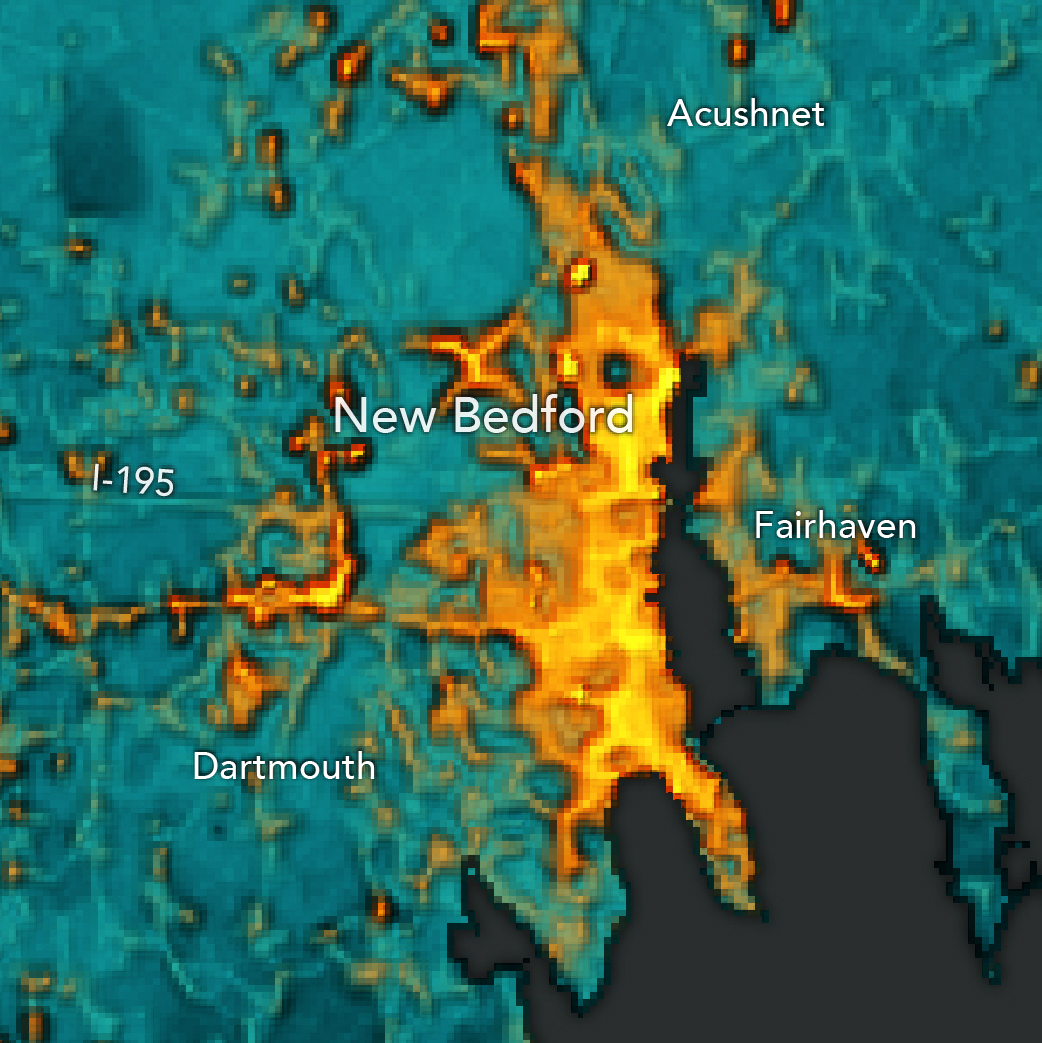
New Bedford heat islands
New Bedford. New Bedford is something like the seventh most populous town in Massachusetts. It’s dense with development too, right up to the water’s edge, as reflected in this heat map. The hot streak of development along Route 6 cuts straight through town too.
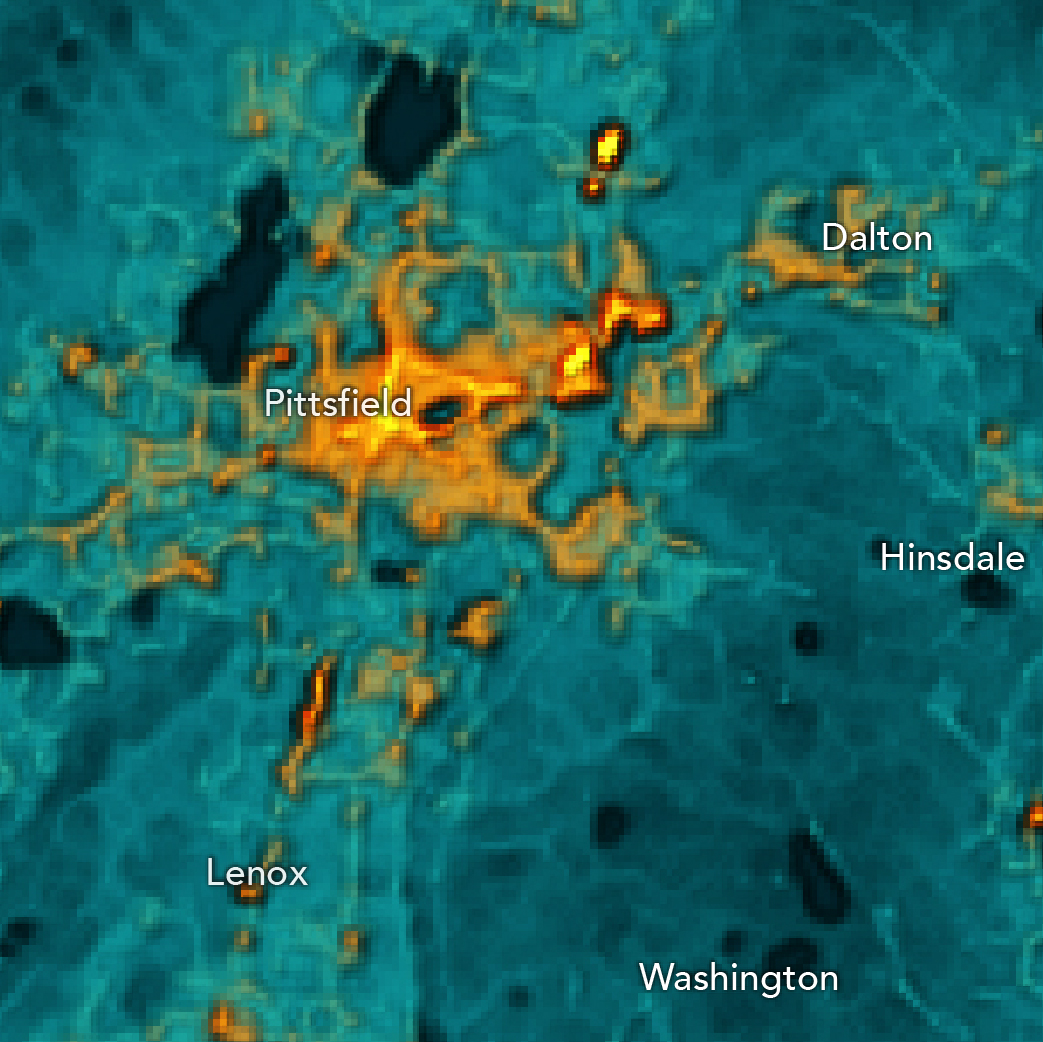
Pittsfield area heat islands
Pittsfield. There are cool lakes in the hinterlands here. Pittsfield is a scorching island and heat from roads in the area are shown here rising above their surroundings. Even the relatively remote roads stand out.
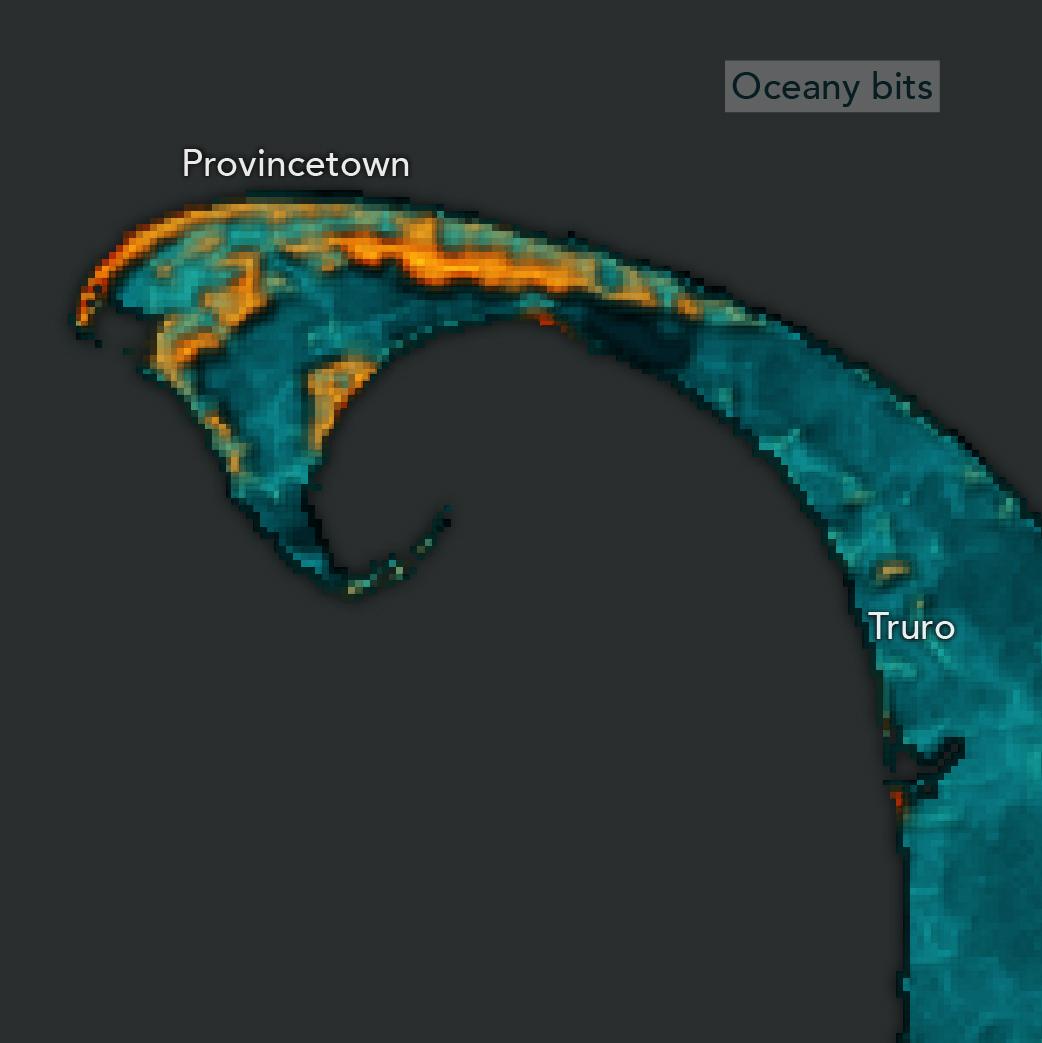
Provincetown heat islands
Provincetown. One of the things I enjoy most about the patterns of heat islands throughout the whole state is that you can see local and regional cooling patterns. In the west, it’s The Berkshires. On The Cape, it’s the ocean. But Provincetown will not be cooled (at least not entirely)! And it’s not even the brightest and hottest area in this image. That would be the sands of The Cape in places like those at Race Point Beach. (Also you can just barely see the adorable Provincetown Muni Airport).
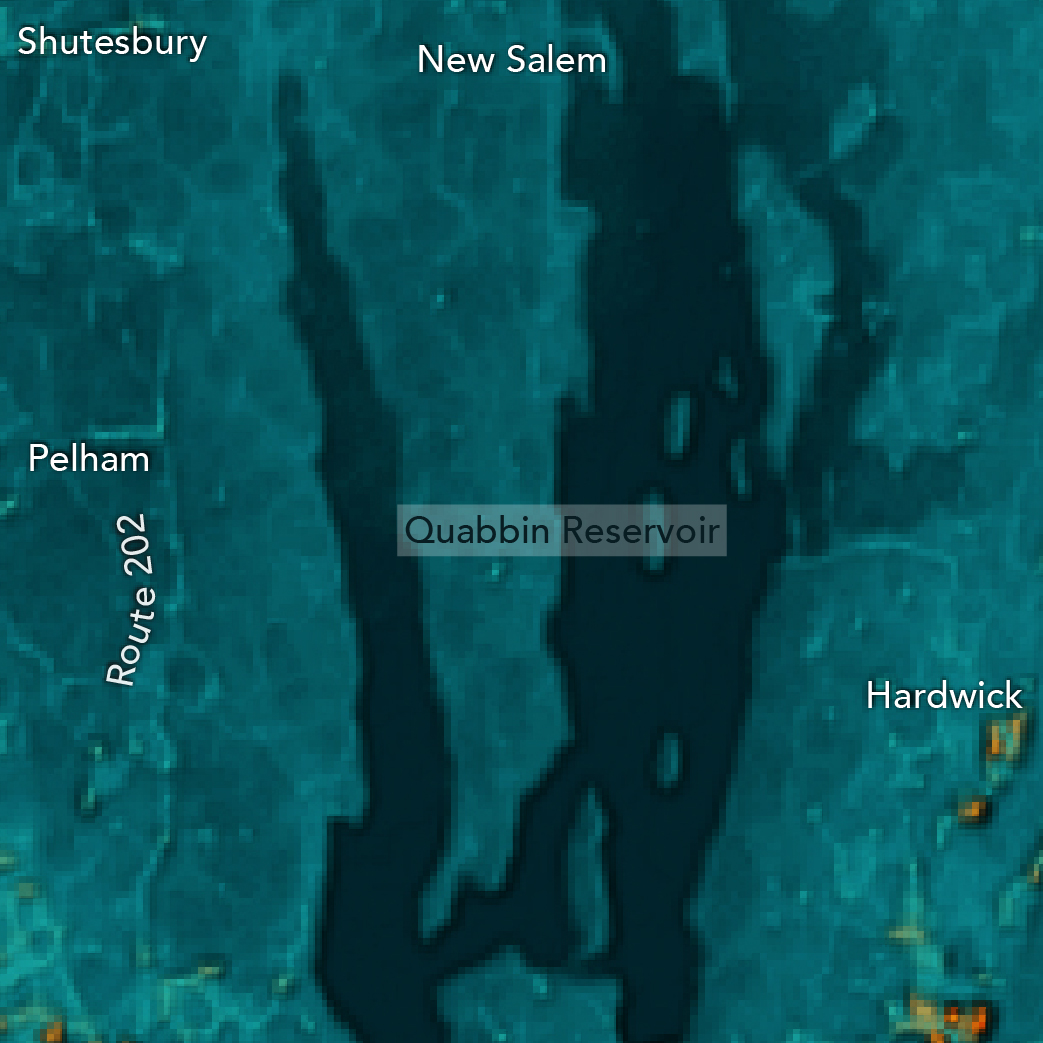
Cool Quabbin Reservoir area
Quabbin Reservoir. I’ve long been haunted by the Quabbin. And this image isn’t going to help that one bit. The reservoir and its immediate surroundings—including some towns—are ghostly cool. Route 202 and Hardwick offer the only warmth.
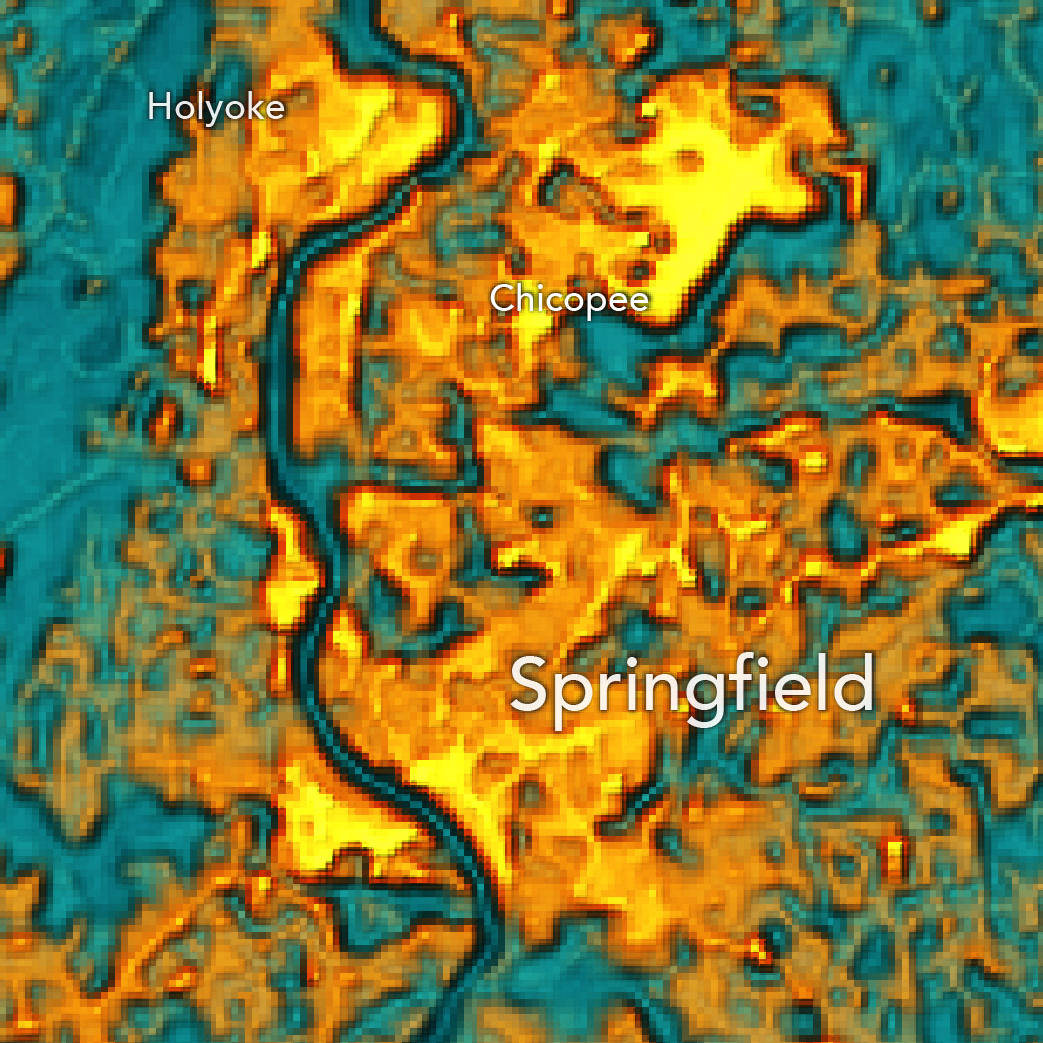
Springfield area heat islands
Springfield. This area definitely jumped out at me when I first took a glance at the statewide map. I know, I know—Springfield is a city. But the way it’s squashed between Central Mass (hellooo, Quabbin) and the Berkshires (both of which are cool parts of the state) had me falsely assuming Springfield would be a bit cooler. It’s not. It’s a massive heat island spanning both sides of the Connecticut River.
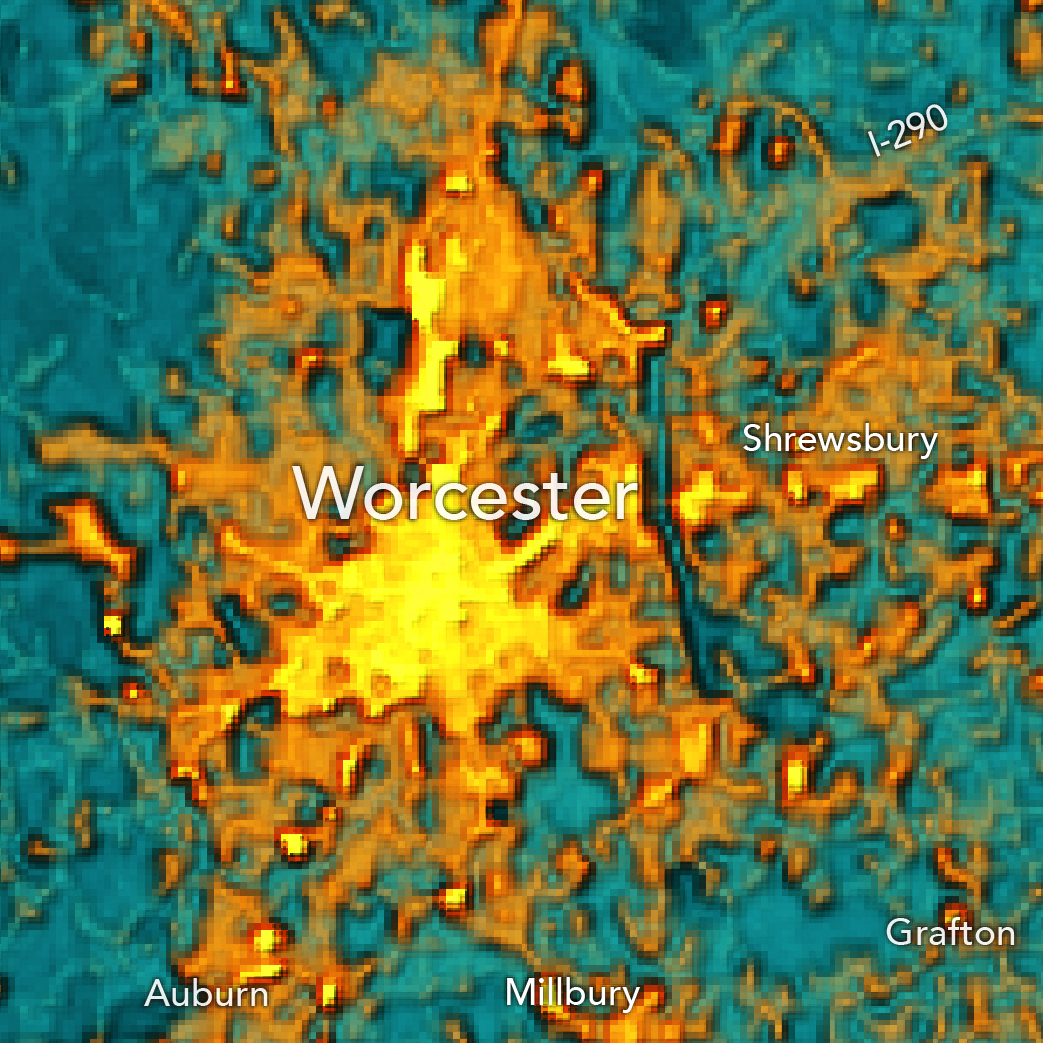
Worcester area heat islands
Worcester. Worcester and its spiderweb of state routes make for a real splat of heat in east-central Massachusetts. The heat spreads east before it’s abruptly brought to a halt by Lake Quinsigamond. The hottest areas only proceed east along Route 9 in Shrewsbury. Crow Hill and Bell Pond offer tiny areas of relief from heat exacerbated by the urban built environment.
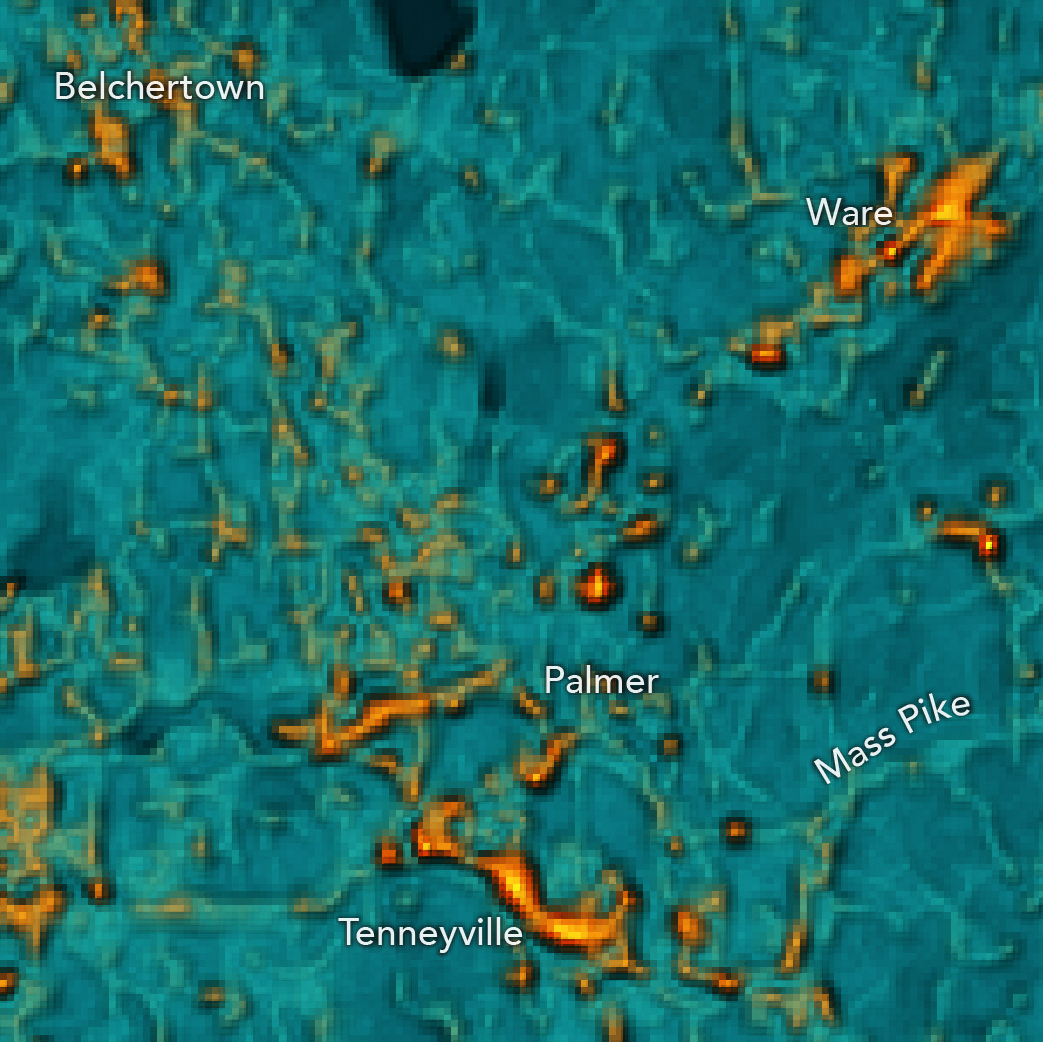
Belchertown area heat islands
Belchertown. I know a lady from Belchertown. She’s a very kind human so I thought I’d take a look at this area too. As with several other snapshots like this of the state, many state routes and large local roads stand in hot relief over their cooler, wooded backgrounds. Tenneyville is the one exception here. Even the Mass Pike isn’t so hot.
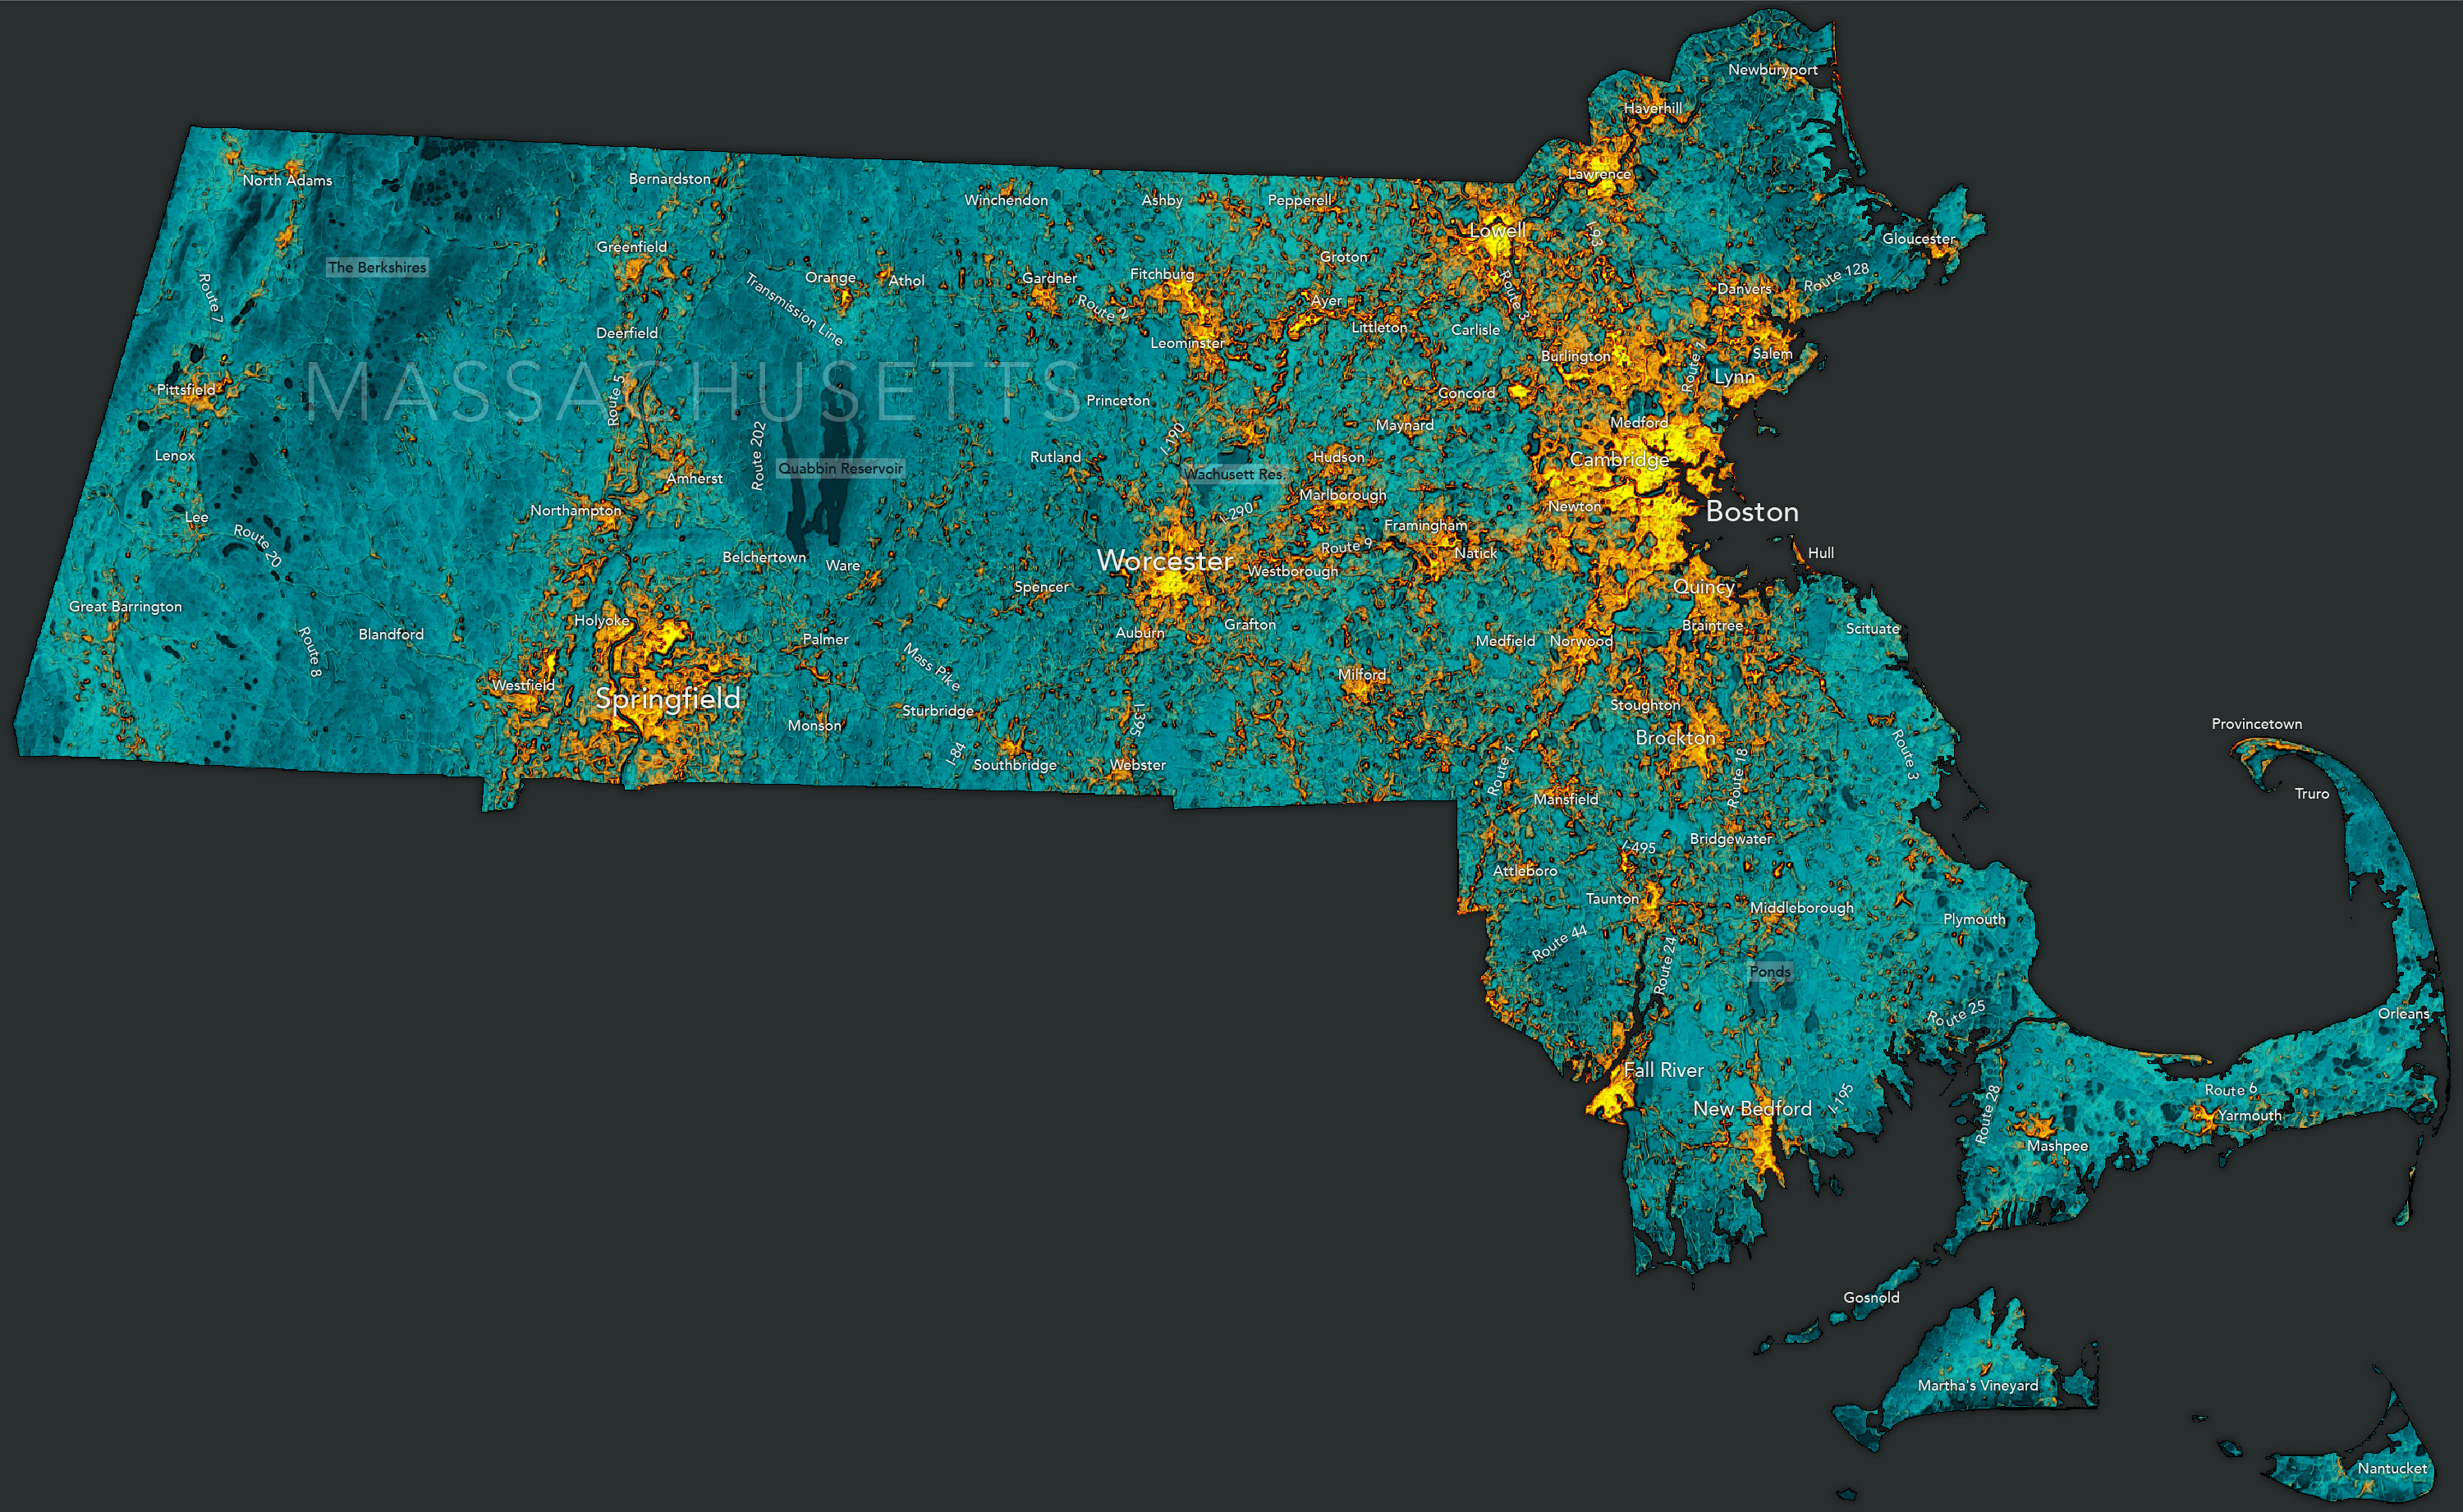 The Whole State. The general concept of heat islands is that they are, well, islands. So it’s helpful to look at the metaphorical body of water they sit in to see their patterns across an expanse. Here is our beloved Massachusetts. The heat islands look like a population density map. And that makes sense. We build things like roads, airports and giant buildings where people live. In the snapshots above that show portions of the state at a different scale, we’ve observed that even within these islands, it’s not all hot. (So, no, I’m not saying let’s flood a bunch more towns!) Throughout the state, we see that parks and green infrastructure really do cool the urban and suburban environment.
So if it’s too hawt and you want it to be nawt, build a pahk, eh?